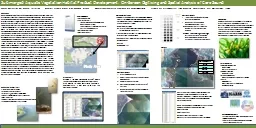
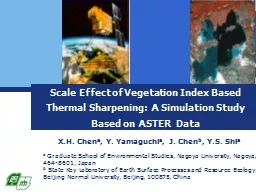
XH Chen a Y Yamaguchi a J Chen b YS Shi a a Graduate School of Environmental Studies Nagoya University Nagoya 4648601 Japan b State Key Laboratory of Earth Surface Processes and Resource Ecology Beijing Normal University Beijing 100875 China ID: 384672
Download Presentation The PPT/PDF document "Scale Effect of Vegetation Index Based T..." is the property of its rightful owner. Permission is granted to download and print the materials on this web site for personal, non-commercial use only, and to display it on your personal computer provided you do not modify the materials and that you retain all copyright notices contained in the materials. By downloading content from our website, you accept the terms of this agreement.
Slide1
Scale Effect of Vegetation Index Based Thermal Sharpening: A Simulation Study Based on ASTER Data
X.H. Chen
a
, Y. Yamaguchi
a
, J. Chen
b
, Y.S. Shi
a
a
Graduate School of Environmental Studies, Nagoya University, Nagoya, 464-8601, Japan
b
State Key Laboratory of Earth Surface Processes and Resource Ecology, Beijing Normal University, Beijing, 100875, ChinaSlide2
Outlines
Introduction
1
TsHARP
2
Scale Effect of NDVI-
T
Relationship
3
Improved
TsHARP
Method
4
6
Discussion and Conclusion
5Slide3
1. INTRODUCTION
Thermal infrared (TIR) band imagery has been widely applied in many studies (e.g. evapotranspiration
esitimation
; urban heat island; drought monitoring, etc.)
Unfortunately, the spatial resolution of TIR bands is usually coarser than that of
visble-near infrared (VNIR) bands
Several thermal sharpening methods have been developed for sharpening spatial resolution of TIR band by using VNIR bandSlide4
Vegetation Index Based Thermal Sharpening
TsHARP
(
Kutas et al, 2003) was intensively studied
Negative correlation between NDVI and surface temperature (T)NDVI-
T Relationship established on coarse resolution is applied on fine resolution.Previous studies found that the spatial resolution does not affect NDVI-T relationship largely;However, another factor, spatial extent, was largely neglected in the previous studies.Our study aims to: Investigate the scale effect of NDVI-TImprove TsHARP by considering the effect of
spatial extentSlide5
2. TsHARP
Establish relationship between
T
and NDVI on the coarse resolution
The
regression relationship is applied to the NDVI at their finer resolution (
NDVI
high). Then, the divergence of the retrieved temperatures from the observed temperature field is due to spatial variability in T driven by factors other than vegetation cover, and can be assessed at the coarse resolution
This coarse-resolution residual field is added back into the sharpened map
The slope is key parameter for sharpening resultSlide6
3. SCALE EFFECT OF NDVI-
T
3.1 Data
A subset image (256×256 pixels) with 90m
resolution
of ASTER captured in
the grassland in Inner
Mongolia, China (44.6ºN, 116.0ºE), on the date of July 16th, 2010, was used for study. A subset image (256)
VNIR band
NDVI
Surface TemperatureSlide7
SCALE EFFECT OF NDVI-T
Two aspects of “Scale”
Spatial
Resolution (size of a pixel)
Spatial Extent (size of
study area)
90m
720m
1440mSlide8
NDVI-T Relationship on Different Resolutions
NDVI and
T
images were resampled to different spatial resolutions (90m to 2880m
) by
linear aggregation.
Slope (
a) of NDVI-T on different resolutions were investigated
The regressed slope increases slightly with increasing of spatial resolutionSlide9
Spatial Extent of
m
pixels
Original image is divided into N/(
m×m
) windows.Average the values of the pixels in each windowLocal difference image is derived by subtracting the original image with the averaged image
Regression is conducted on the local difference images of NDVI and T
Local Difference Image
NDVI-
T
Relationship on Different ExtentsSlide10
Regressed slope (
a
) increases with the increasing of spatial extent following a power function
Compared with spatial resolution, spatial extent affects regressed slope more largely.
(a)
(b)
Spatial extent (m)Slide11
4. IMPROVED TsHARP
Sharpening
T
image is equal to retrieving the local difference image of
T on extent of a thermal pixel.
The regression relationship should be established on the spatial extent of one thermal pixel
Spatial Extent
Slope
Slope on extent of whole image (
a
)
Slope on extent of one thermal pixel (
a
local
)
: Unkown without high resolution T image
Slope on extent of 2×2 thermal pixels
We use
the power function of (spatial extent -regressed slope) to estimate the slope (
a
local
) on the
extent of one thermal pixel
;
Improved TsHARP replaces a with
a
localSlide12
Algorithm Test
T
image with 900m resolution was generated.
The coarse
T image was sharpened to 90m using TsHARP
and improved TsHARP respectively
TsHARP
(a)
Improved
TsHARP
(alocal)Spatial extent (m)
(23040m, 38.1)Slide13
Sharpened Result
Image sharpened by Improved
TsHARP
is smoother than that by original
TsHARP
℃
(c)
TsHARP
Improved TsHARP
True
T
image
Coarse
T
imageSlide14
Accuracy Assessment
Improved TsHARP
TsHARP
Best slope
The best value of slope is around 15.9
Improved method acquired higher sharpening accuracy
Original
TsHARP
over-sharpens the
T
image
Actual
T
image with 90m is used for accuracy assessmentSlide15
15
5. DISCUSSION and CONCLUSION
Why spatial extent affects the NDVI-
T
relationship?
Other than NDVI, soil moisture also affects surface temperature. Assuming that
Since NDVI is somehow positively correlated with soil moisture, when T is regressed with only NDVI, the regressed slope becomes (for convenience, we assume the data is standardized)As spatial pattern of moisture is smoother than NDVI, when spatial extent increases, the correlation between NDVI and Moisture increases, consequently the regressed slope also increases.Slide16
Conclusion
Spatial extent is an important factor affecting the NDVI-
T
relationship, and should not be neglected in the related studies
Improved
TsHARP considers the effect of spatial extent and can acquire better sharpening result in this case of study.Slide17
Click to edit company slogan .
Thank you