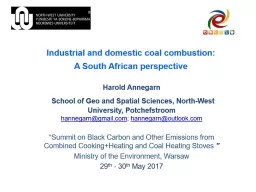
A South African perspective Harold Annegarn School of Geo and Spatial Sciences NorthWest University Potchefstroom hannegarngmailcom hannegarnoutlookcom Summit on Black Carbon and Other Emissions from Combined ID: 596695
Download Presentation The PPT/PDF document "Industrial and domestic coal combustion:" is the property of its rightful owner. Permission is granted to download and print the materials on this web site for personal, non-commercial use only, and to display it on your personal computer provided you do not modify the materials and that you retain all copyright notices contained in the materials. By downloading content from our website, you accept the terms of this agreement.
Slide1
Industrial and domestic coal combustion:A South African perspective
Harold Annegarn School of Geo and Spatial Sciences, North-West University, Potchefstroom hannegarn@gmail.com; hannegarn@outlook.com “Summit on Black Carbon and Other Emissions from Combined Cooking+Heating and Coal Heating Stoves ”Ministry of the Environment, Warsaw29th - 30th May 2017Slide2
Air quality issues in RSADomestic combustion emissions (coal, wood, kerosene)Coal-fired power plant emissionsWild-fire emissions (local and regional)
Vehicle emissionsIndustrial emissionsWind-blown dust from mine tailingsExamine solutions that are: “Leapfrogging with strategies that are affordable, scalable, inclusive and inventive”Slide3
A tale of township pollution – biomass and coal combustion in South African informal settlements
3
Credit - Philip Lloyd, UCTSlide4
Annegarn
4
Credit:
Attie
van Niekerk, Nova
“
Imbuala
” brazier-type coal stove,
used in informal settlements
Ambient or indoor pollution hazard?Slide5
Annegarn
5
The mystery of smoke revealed:
Combustion aerosol particle from domestic coal burning – condensed VOCs (volatile organic carbons)Slide6
Monthly mean particulate conc. (µg/m
3)Old South African
PM10 guideline
Ambient monthly average PM10 particulate
concs
: Soweto
New South African
PM10 guideline
Monthly mean PM10 concentrationsSlide7
Examples of emissions from top-down and
bottom-up coal fire lighting methodsBasa njenga Magogo “Make fire like the old lady”
7Slide8
Flame zone
VOCs and SVOCs combusted
Hot zone –
VOC distillation
Cool zone –
SVOC condensation
Hot zone –
VOC distillation
Flame zone
Classical fire-lighting methodology
Unburnt fuel
= air pollution
8
TLDD
– Top-Lit Down Draft
Pyrolysis front moving downwards through fuel bedSlide9
Sulphur is liberated throughout the burn: emitted as SO2 or H
2SSlide10
Energy PovertyIf residential areas (post-apartheid) are extensively connected to electrical grid, why is there not a reduction in use of domestic solid fuel combustion?
Electricity is not an economic option for space heating!Energy poverty – a definition:Spending more than 10% of household disposable income on energy services A scalable conceptThe poor suffer disproportionate health and safety risk from use of domestic energySlide11
Annegarn
11
Baseline: negative externalities of domestic energy use
- defective housing and energy systems
Photos by Susan CookSlide12
Annegarn & Guy12
Rebuilding after a shack fireSlide13
Leapfrogging the Rights to Clean Air – the South African Experience 1. A constitutional Right to Clean Air
2. Public health and power plant emissions – a novel approach to emission offsets3. Reducing domestic emissions – improved stove testing procedures4. Satellite images for determining regional air quality and DALYsSlide14
A constitutional Right to Clean AirSouth African Constitution provides for:
And whereas everyone has the constitutional right to an environment that is not harmful to their health or well-being;And whereas everyone has the constitutional right to have the environment protected, for the benefit of present and future generations, through reasonable legislative and other measures.Slide15
The South African approachSouth African environmental law is based on the concept of cooperative governance, rather than centralised command and control
Change from source control to management of receiving environmentIndividual rights and agency, entrenched public consultationRegulators, industry environmental AQ managers, AQ consultants become important agents of protecting environmental rights Slide16
Southern African thermal power generation:
location and rated powerCourtesy of Gavin Fleming CSIR
Thermal power generation (MW)
3600Slide17
© Annegarn 1 April 2011 NACA17
Acid rain! Or not? The passive diffusive sampling network distribution
Power plant source regionSlide18
© Annegarn 1 April 2011 NACA18
Net acidic deposition (meq m-2 y-1)Contours derived from passive deposition networkSlide19
Preliminary Results from GOME
Daily NO2 column depth over southern Africa
2000-08-18
2000-08-31Slide20
© Annegarn 1 April 2011 NACA20
Annual mean SO2 compared to critical levelsSlide21
© Annegarn 1 April 2011 NACA21
Acid deposition verdict? Not guilty as charged!BUT….Stack emissions of SO2 and NOx exceed permissible emission rates; occasional ambient ground level exceedencesDepartment of Environment Affairs has devised a novel offsets policy:In terms of Atmospheric Emission Licences (AEL), company given conditional exemption to continue current emissions (for five years) if they implement, monitor and demonstrate exposure reduction to domestic combustion emissions within impact zone surrounding power plant (~50 km )Slide22
Reduction strategies for power plant offsetsInsulation of dwellings to reduce space heating needs
Fuel/stove substitution with improved stoves or different energy carriersElectricity too expensive for space heating & cookingLPG gas a technically viable option butMay need a continuing fuel subsidyNo indigenous LPG supply; lacking infrastructure for bulk LPG importKerosene fuelled stoves are poorly constructed and a serious fire accident hazard; odour of kerosene socially undesirableAvailable solid fuel (wood and coal) stoves still high emitters of PM2.5 - need for improved stove technologies to burn widely available, inexpensive or no cash cost fuelsSlide23
Reducing domestic emissions – improved stove testing protocolsWe recognised a need for standardised method for performance evaluation of improved cookstoves
Devised new test from first principles – SeTAR Centre Heterogeneous Testing Protocol, Based on mass balance measurementsRecognises that the system under test is [stove plus fuel] - cannot devise a useful test using a universally standardised fuel or a standardised burn sequenceSlide24
Satellite images for determining regional air quality and DALYs
Regional or continental scale estimates of human exposure and externality costs make use of aerosol climatology resultsCan be based on ground level monitoring, emissions inventories and dispersion modelling orUse of satellite based retrievals of aerosol products.We have devised a method using 10-day average aerosol optical depths and unsupervised classification to derive a aerosol classification over South Africa (Kneen et al. Atmos Envir. 2016)Slide25
Classes defined on the ten-day average time‑series patterns created using ten‑year seasonally averaged PM2.5 column depth Google Earth image with the PM2.5
classification (40x1) version superimposed. Slide26
Higher resolution image of the Johannesburg metropolitan conglomerate (southern Gauteng Province) draped over a Google Earth satellite image, with partial transparency of the classes.Slide27
Uses and limitations of satellite aerosol retrievalsSatellite retrievals provide realistic spatial and seasonal concentrations over large areas – useful for estimating
Disability Adjusted Life Years (DALYs) on epidemiological scalesLimitations are satellite retrievals miss nocturnal level high concentrations in concentrated informal settlements. These account for a large fraction of population exposure (Cumulative exposure = concentration x duration x number exposed). Regional exposure assessment models, such as the IIASA Greenhouse Gas - Air Pollution Interactions and Synergies (GAINS) model, need to incorporate nested regions to address this factor (http://gains.iiasa.ac.at/models/)Slide28
© Annegarn 1 April 2011 NACA28
SAWB AEROCOMMANDER 690A ZS JRB
, equipped for tropospheric aerosol and gas measurements
From whence cometh the smoke? Slide29
Provided by the SeaWiFS Project, NASA/Goddard Space Flight Center, and ORBIMAGE
Satellite: OrbView-2 Sensor: SeaWiFSImage Date: 09-04-2000Image captured by CSIR Satellite Application CentreBiomass burning smoke and haze exiting off east coast 4 September 2000
RIVER OF SMOKE
Aerosol transport pattern dubbed the
River of SmokeSlide30
ConclusionsRegulation, monitoring, mitigation and exposure assessment from solid fuel combustion are not operated in isolationThe strict regulatory approach developed in the USA and Europe, and aspirational guidelines set by WHO, are products of a particular historical evolution, and are not necessarily the best or most cost effective tools for air quality management in developing countries
Constant evaluation of received wisdom, and innovative regulation, monitoring and assessment should be part of our continuing efforts to realise our RIGHT TO CLEAN AIR Slide31
Acknowledgements to ERGO GOLD Ltd for permission to use data and access to sites;
To NRF and Eskom for long-term support for atmospheric, energy and remote sensing research;
To University of Johannesburg (SeTAR Centre Grant)
Energy Institute