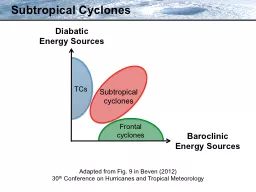
Diabatic Energy Sources Baroclinic Energy Sources Adapted from Fig 9 in Beven 2012 30 th Conference on Hurricanes and Tropical Meteorology TCs Subtropical cyclones Frontal cyclones ID: 564224
Download Presentation The PPT/PDF document "Subtropical Cyclones" is the property of its rightful owner. Permission is granted to download and print the materials on this web site for personal, non-commercial use only, and to display it on your personal computer provided you do not modify the materials and that you retain all copyright notices contained in the materials. By downloading content from our website, you accept the terms of this agreement.
Slide1
Subtropical Cyclones
Diabatic
Energy Sources
BaroclinicEnergy Sources
Adapted from Fig. 9 in Beven (2012)30th Conference on Hurricanes and Tropical Meteorology
TCs
Subtropical cyclones
Frontal cyclonesSlide2
Davis (2010) methodology:
Based
on
Ertel potential vorticity (PV)Formulated in terms of two PV metrics that quantify the relative contributions of baroclinic processes and condensation heating to the evolution of individual cyclonesDavis (2010) methodology is similar to Hart (2003) cyclone phase space diagrams
Adapted Davis (2010) MethodologySlide3
Adapted Davis (2010) Methodology
Lower
-tropospheric
baroclinic processes:
(near-surface potentialtemperature anomaly)
absolute
vorticity
425 hPa
Potential temperature anomaly
Length of 6° box centered on cycloneSlide4
Adapted Davis (2010) Methodology
PV1/PV2
:
measure of the contribution of lower-tropospheric
baroclinic processes relative to the contribution of condensation heating
Lower
-troposphericbaroclinic processes:(near-surface potentialtemperature anomaly)
Midtropospheric
latent heat release:(interior PV anomaly)
425 hPa
Ertel
PV anomaly
Potential temperature anomaly
Length of 6° box centered on cyclone
absolute
vorticitySlide5
Adapted Davis (2010) Methodology
200 hPa
925 hPaSlide6
Lower
-tropospheric
baroclinic processes (PV1)
200 hPa
925 hPa
Adapted Davis (2010) Methodology
Lower
-tropospheric
baroclinic processes
:
(
near
-surface
potential
temperature anomaly)Slide7
Lower
-tropospheric
baroclinic processes (PV1)
200 hPa
925 hPa
Adapted Davis (2010) Methodology
Lower
-tropospheric
baroclinic processes
:
(
near
-surface
potential
temperature anomaly)
Midtropospheric
latent
heat
release
:
(
interior PV anomaly)Slide8
5
00 hPa
Lower
-tropospheric
baroclinic processes (PV1)
200 hPa
925 hPa
Adapted Davis (2010) Methodology
Midtropospheric
latent heat release
(PV2)
Lower
-tropospheric
baroclinic processes
:
(
near
-surface
potential
temperature anomaly)
Midtropospheric
latent
heat
release
:
(
interior PV anomaly)
PV1/PV2
:
measure of the contribution of lower-tropospheric
baroclinic processes relative to the contribution of condensation heatingSlide9
Adapted Davis (2010) Methodology
Additional metric introduced to diagnose upper-tropospheric dynamical processes
Upper-tropospheric
dynamical processes:(upper-tropospheric PV anomaly)
Ertel PV anomaly
300 hPa
Length of 6° box centered on cycloneSlide10
5
00 hPa
Lower
-tropospheric
baroclinic processes (PV1)
200 hPa
925 hPa
Adapted Davis (2010) Methodology
Midtropospheric
latent heat release
(PV2)
Lower
-tropospheric
baroclinic processes
:
(
near
-surface
potential
temperature anomaly)
Midtropospheric
latent
heat
release
:
(
interior PV anomaly)
PV1/PV2
:
measure of the contribution of lower-tropospheric
baroclinic
processes relative to the contribution of condensation heatingSlide11
5
00 hPa
Lower
-tropospheric
baroclinic processes (PV1)
200 hPa
925 hPa
Adapted Davis (2010) Methodology
Midtropospheric
latent heat release
(PV2)
Upper-
tropospheric
dynamical processes
(PV3)
Lower
-tropospheric
baroclinic processes
:
(
near
-surface
potential
temperature anomaly)
Midtropospheric
latent
heat
release
:
(
interior PV anomaly)
Upper-tropospheric
dynamical processes:
(
upper-tropospheric
PV anomaly)
PV1/PV2
:
measure of the contribution of lower-tropospheric
baroclinic
processes relative to the contribution of condensation heatingSlide12
5
00 hPa
Lower
-tropospheric
baroclinic processes (PV1)
200 hPa
925 hPa
Adapted
Davis (2010) Methodology
Midtropospheric
latent heat release
(PV2)
Upper-
tropospheric
dynamical processes
(PV3)
PV1/PV2
:
measure of the contribution of lower-tropospheric
baroclinic
processes relative to the contribution of condensation heating
Calculated from the
0.5° Climate Forecast
System Reanalysis
V2 datasetSlide13
Hurricane Sandy
: 6° × 6° box, NHC Best Track
Peaks in PV3
PV1/PV222 October23 October24 October25 October26 October27 October
28 October29 October30 October31 OctoberPVUSlide14
Hurricane Sandy
: 10° × 10° box,
NHC Best Track
Peaks in PV3PV1/PV2PVU22 October23 October24 October
25 October26 October27 October28 October29 October30 October31 OctoberSlide15
Hurricane Sandy
: 12° × 12° box,
NHC Best Track
Peaks in PV3PV1/PV2PVU22 October23 October24 October
25 October26 October27 October28 October29 October30 October31 OctoberSlide16
Hurricane Sandy
: 14° × 14° box, NHC Best Track
PVU
PV1/PV2Peaks in PV322 October23 October24 October25 October
26 October27 October28 October29 October30 October31 OctoberSlide17
Hurricane Sandy
: 16° × 16° box, NHC Best Track
PVU
PV1/PV2Peaks in PV322 October23 October24 October25 October
26 October27 October28 October29 October30 October31 OctoberSlide18
Hurricane Sandy
: 18° × 18° box, NHC Best Track
PVU
PV1/PV2Peaks in PV322 October23 October24 October25 October
26 October27 October28 October29 October30 October31 OctoberSlide19
Hurricane Sandy
: 20° × 20° box, NHC Best Track
PVU
PV1/PV2Peaks in PV322 October23 October24 October
25 October26 October27 October28 October29 October30 October31 OctoberSlide20
5
00 hPa
Lower
-tropospheric
baroclinic processes (PV1)
200 hPa
925 hPa
Adapted Davis (2010) Methodology
Midtropospheric
latent heat release
(PV2)
Upper-
tropospheric
dynamical processes
(PV3)
Lower
-tropospheric
baroclinic processes
:
(
near
-surface
potential
temperature anomaly)
Midtropospheric
latent
heat
release
:
(
interior PV anomaly)
Upper-tropospheric
dynamical processes:
(
upper-tropospheric
PV anomaly)
PV1/PV2
:
measure of the contribution of lower-tropospheric
baroclinic
processes relative to the contribution of condensation heatingSlide21
300 hPa
Lower
-tropospheric
baroclinic processes (PV1)
200 hPa
925 hPa
Adapted Davis (2010) Methodology
Midtropospheric
latent heat release
(PV2)
Upper-
tropospheric
dynamical processes
(PV3)
Lower
-tropospheric
baroclinic processes
:
(
near
-surface
potential
temperature anomaly)
Midtropospheric
latent
heat
release
:
(
interior PV anomaly)
Upper-tropospheric
dynamical processes:
(
upper-tropospheric
PV anomaly)
PV1/PV2
:
measure of the contribution of lower-tropospheric
baroclinic
processes relative to the contribution of condensation heatingSlide22
Hurricane Sandy
: 6° × 6° box, 500 hPa, NHC Best Track
Peaks in PV3
22 October23 October24 October25 October26 October27 October28 October
29 October30 October31 OctoberPVUPV1/PV2Slide23
Peaks in PV3
22 October
23 October
24 October25 October26 October27 October28 October29 October
30 October31 OctoberHurricane Sandy: 6° × 6° box, 300 hPa, NHC Best TrackPVUPV1/PV2Slide24
300 hPa
Lower
-tropospheric
baroclinic processes (PV1)
200 hPa
925 hPa
Adapted Davis (2010) Methodology
Midtropospheric
latent heat release
(PV2)
Upper-
tropospheric
dynamical processes
(PV3)
Lower
-tropospheric
baroclinic processes
:
(
near
-surface
potential
temperature anomaly)
Midtropospheric
latent
heat
release
:
(
interior PV anomaly)
Upper-tropospheric
dynamical processes:
(
upper-tropospheric
PV anomaly)
PV1/PV2
:
measure of the contribution of lower-tropospheric
baroclinic
processes relative to the contribution of condensation heatingSlide25
5
00 hPa
Lower
-tropospheric
baroclinic processes (PV1)
200 hPa
925 hPa
Adapted
Davis (2010) Methodology
Midtropospheric
latent heat release
(PV2)
Upper-
tropospheric
dynamical processes
(PV3)
PV1/PV2
:
measure of the contribution of lower-tropospheric
baroclinic
processes relative to the contribution of condensation heating
Calculated from the
0.5° Climate Forecast
System Reanalysis
V2 dataset