PPT-How do we generate the statistics of a function of a random variable?
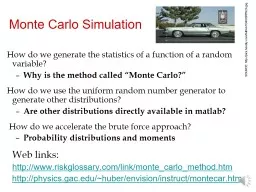
Why is the method called Monte Carlo How do we use the uniform random number generator to generate other distributions Are other distributions directly available
Download Presentation
"How do we generate the statistics of a function of a random " is the property of its rightful owner. Permission is granted to download and print materials on this website for personal, non-commercial use only, provided you retain all copyright notices. By downloading content from our website, you accept the terms of this agreement. Download
Presentation Transcript
Transcript not available.