/
V25: the histone code   25. lecture WS 2019/20 V25: the histone code   25. lecture WS 2019/20

V25: the histone code 25. lecture WS 2019/20 - PowerPoint Presentation

hanah
hanah . @hanah
Follow
64 views
Uploaded On 2024-01-29

V25: the histone code 25. lecture WS 2019/20 - PPT Presentation

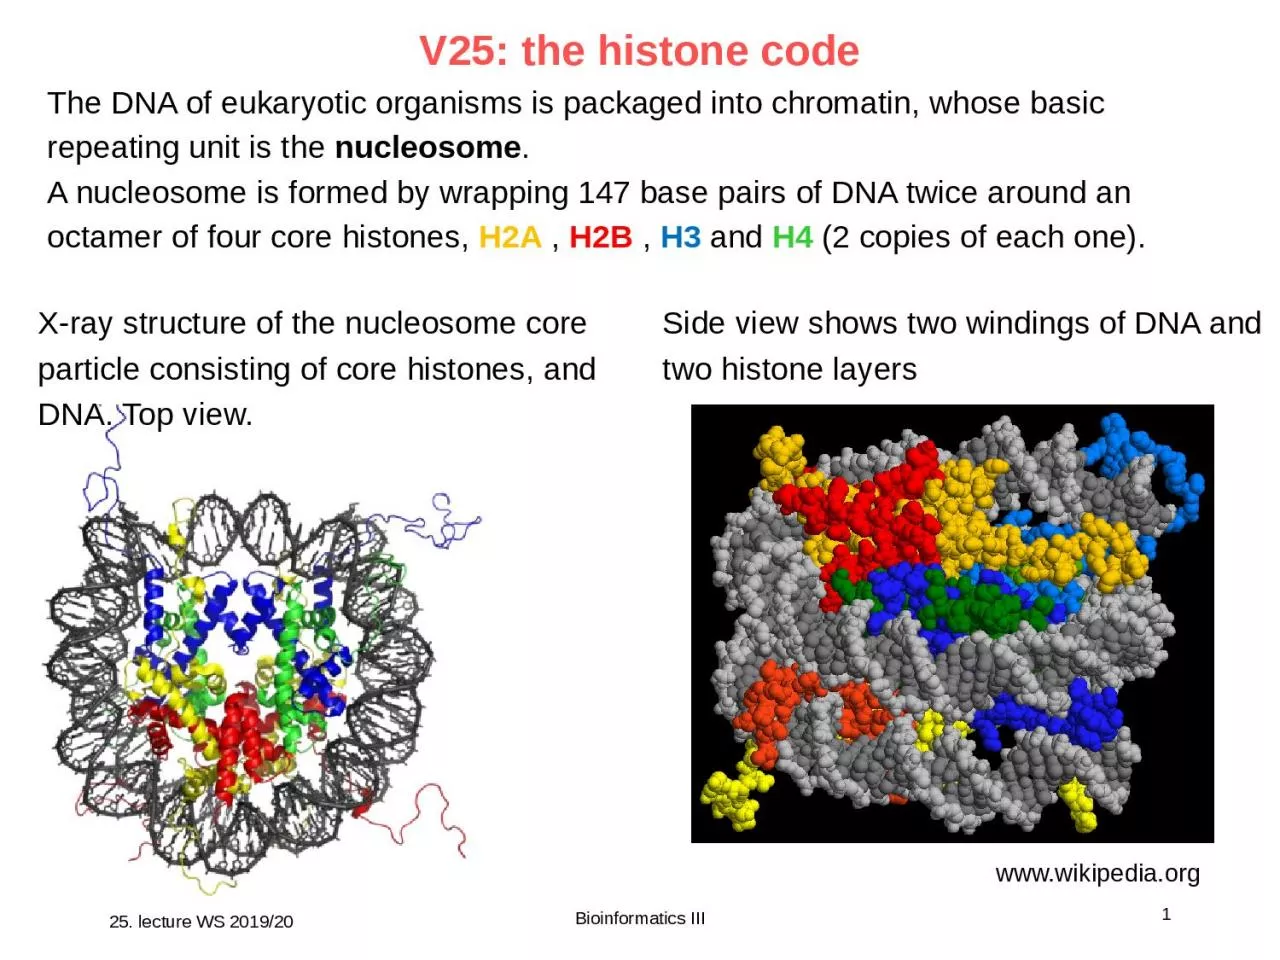
1 Bioinformatics III Xray structure of the nucleosome core particle consisting of core histones and DNA Top view wwwwikipediaorg Side view shows two windings of DNA and two histone layers The DNA of eukaryotic organisms is packaged into chromatin whose basic repeating unit is the ID: 1043284

2019 lecture modifications histone lecture 2019 histone modifications dna models chromatin regions model modification 2015 expression ptms cells gene

Share:

Link:

Embed:

Download Presentation from below link

Download Presentation The PPT/PDF document "V25: the histone code 25. lecture WS 2..." is the property of its rightful owner. Permission is granted to download and print the materials on this web site for personal, non-commercial use only, and to display it on your personal computer provided you do not modify the materials and that you retain all copyright notices contained in the materials. By downloading content from our website, you accept the terms of this agreement.


Presentation Transcript

1. V25: the histone code 25. lecture WS 2019/201Bioinformatics IIIX-ray structure of the nucleosome core particle consisting of core histones, and DNA. Top view.www.wikipedia.orgSide view shows two windings of DNA and two histone layersThe DNA of eukaryotic organisms is packaged into chromatin, whose basic repeating unit is the nucleosome. A nucleosome is formed by wrapping 147 base pairs of DNA twice around an octamer of four core histones, H2A , H2B , H3 and H4 (2 copies of each one).

2. Basic principles of epigenetics:DNA methylation and histone modfications The human genome contains ~20 000 genes that must be expressed in specific cells at precise times. In cells, DNA is wrapped around clusters (octamers) of globular histone proteins to form nucleosomes.These nucleosomes of DNA and histones are organized into chromatin, the building block of a chromosome.Rodenhiser, Mann, CMAJ 174, 341 (2006)Bock, Lengauer, Bioinformatics 24, 1 (2008)25. lecture WS 2019/202Bioinformatics III

3. Epigenetic modificationsReversible and site-specific histone modifications occur at multiple sites at the unstructured histone tails through acetylation, methylation and phosphorylation. DNA methylation occurs at 5-position of cytosine residues within CpG pairs in a reaction catalyzed by DNA methyltransferases (DNMTs). Rodenhiser, Mann, CMAJ 174, 341 (2006)25. lecture WS 2019/203Bioinformatics III

4. Post-translational modifications of histone tails25. lecture WS 2019/204Bioinformatics IIIThe disordered histone tails comprise 25-30% of the histone mass.They extend from the compact histone multimer to provide a platform for various post-translational modifications (PTMs). These modifications affect the histones' ability to bind DNA and to other histones.This, in turn affects gene expression.Strahl BD and Allis CD, 2000. Nature 403:41-45PNAS 1964;51:786First report on PTMsof histones

5. Mode of action of histone PTMs25. lecture WS 2019/205Bioinformatics IIIHistone PTMs exert their effects via two main mechanisms. (1) PTMs directly influence the overall structure of chromatin, either over short or long distances. (2) PTMs regulate (either positively or negatively) the binding of effector molecules. Bannister, Kouzarides, Cell Res. (2011) 21: 381–395.

6. PTMs of histone tails25. lecture WS 2019/206Bioinformatics IIIHistone acetylation and phosphorylation effectively reduce the positive charge of histones.This potentially disrupts electrostatic interactions between histones and DNA. This presumably leads to a less compact chromatin structure, thereby facilitating DNA access by protein machineries such as those involved in transcription. Histone methylation mainly occurs on the side chains of lysines and arginines. Unlike acetylation and phosphorylation, however, histone methylation does not alter the charge of the histone protein. Bannister, Kouzarides, Cell Res. (2011) 21: 381–395.By Ybs.Umich - Own work, CC BY-SA 3.0, https://commons.wikimedia.org/w/index.php?curid=31240656

7. H4 tail : conformational dynamics25. lecture WS 2019/207Bioinformatics IIIAll histone tails can influence chromatin compaction and accessibility, depending on salt concentration, construction of the nucleosome arrays, and the type of assembly process.The H4 tail probably plays the most important role in inter-nucleosome interaction.Its middle part, the K16RHRK20 segment forms a positively charged “basic patch”. On the H2A-H2B dimer, the glutamic acid and aspartic acid residues H2A E56, E61, E64, D90, E91, E92, and H2B E102 and E110 build up a negatively charged area, called the “acidic patch”. Due to the spatial proximity and the electrostatic attraction, stable salt bridges can be formed between these two parts from neighboring nucleosomeshttp://www.cell.com/biophysj/abstract/S0006-3495(16)31043-8

8. Molecular dynamics simulations of H4-H2A/H2B-DNA system 25. lecture WS 2019/208Bioinformatics IIILeft: Structure of two nucleosomes from crystal packingRight: the model structure used in atomistic MD simulations. Water not shown. (Green) DNA; (yellow) H3; (gray) H4; (pink) H2A; and (blue) H2B. http://www.cell.com/biophysj/abstract/S0006-3495(16)31043-8

9. Acetylation effects25. lecture WS 2019/209Bioinformatics IIIDistribution of the distance between the H4 tail and the neighboring H2A-H2B dimer in the MD simulations. The center of mass of the backbone atoms of H4 tail residues 7–17 and H2A-H2B dimer are used for distance measurement. The middle part of the AC H4 tail is generally further away from the adjacent H2A-H2B dimer.http://www.cell.com/biophysj/abstract/S0006-3495(16)31043-8The major population of WT is located at ∼2.3–2.5 nm, indicating close contact between H4 tail middle part and the neighboring H2A-H2B dimer. The distribution of AC is broader, ranging from 2.2 to 3.1 nm, and the multiple peaks refer to diverse conformation clusters. The center of the major peak of the AC population (AC-3 and AC-6) is shifted 0.2 nm to the right of the WT center.

10. Acetylation effects25. lecture WS 2019/2010Bioinformatics IIIThe H4 tail is basically disordered due to active electrostatic interaction with outside partners. Only some low-frequency 310-helix structures (formed by i+3→i hydrogen bonds) were found in the WT system.In the AC system, the occupancy of 310-helix structures is twice as high.http://www.cell.com/biophysj/abstract/S0006-3495(16)31043-8Acetylation disrupts the interaction between the H4 tail and the acidic patch.This gives the H4 tail the flexibility to form intratail hydrogen bonds. The increasing intratail interaction helps to stabilize these structures.

11. Protein domains bind to modified histones25. lecture WS 2019/2011Bioinformatics IIIExamples of proteins with domains that specifically bind to modified histones. There are more domain types recognizing lysine methylation than any other PTM.Bannister, KouzaridesCell Res. (2011) 21: 381–395.H3K4me3 – a mark associated with active transcription – is recognized by a PHD finger within the ING family of proteins (ING1-5). The ING proteins in turn recruit additional chromatin modifiers such as HATs and HDACs.

12. Histone modification crosstalk 25. lecture WS 2019/2012Bioinformatics IIIHistone PTMs can positively or negatively affect other PTMs. A positive effect is indicated by an arrowhead and a negative effect is indicated by a flat headBannister, KouzaridesCell Res. (2011) 21: 381–395.The large number of histone PTMs enables tight control of chromatin structure. An extra level of complexity exists due to cross-talk between different modifications, which presumably helps to fine-tune the overall control.

13. Euchromatin vs. Heterochromatin structure25. lecture WS 2019/2013Bioinformatics IIIBannister, KouzaridesCell Res. (2011) 21: 381–395.Eukaryotic genomes can be divided into two geographically distinct environments. (1) a relatively relaxed environment, containing most of the active genes and undergoing cyclical changes during the cell cycle. These 'open' regions are referred to as euchromatin. (2) other genomic regions, such as centromeres and telomeres, are relatively compact structures containing mostly inactive genes. These more 'compact' regions are referred to as heterochromatin. Both heterochromatin and euchromatin are enriched, and indeed also depleted, of certain characteristic histone PTMs. However, there appears to be no simple rules governing the localization of PTMs. There is a high degree of overlap between different chromatin regions. Nevertheless, there are regions of demarcation between heterochromatin and euchromatin. These 'boundary elements' are bound by specific factors such as the “insulator” CTCF.

14. Euchromatin 25. lecture WS 2019/2014Bioinformatics IIIInterplay of factors at an active gene in yeast.Bannister, KouzaridesCell Res. (2011) 21: 381–395.(Left) The scSet1 H3K4 methyltransferase binds to serine5 phosphorylated C-terminal domain (CTD) of RNAPII, the initiating form of polymerase situated at the TSS. (Right) In contrast, the scSet2 H3K36 methyltransferase binds to serine 2 phosphor-rylated CTD of RNAPII, the transcriptional elongating form of polymerase. Thus, the two enzymes are recruited to genes via interactions with distinct forms of RNAPII→ the location of the different forms of RNAPII define where the PTMs are placed

15. Epifactors database25. lecture WS 2019/2015Bioinformatics IIIDatabase (Oxford). 2015; 2015: bav067. The database EpiFactors stores detailed and curated information about 815 proteins and 69 complexes involved in epigenetic regulation. http://epifactors.autosome.ru/protein_complexesMSc thesis topic!Side view shows two windings of DNA and two histone layers

16. Frequency of main annotation terms of epifactor proteins25. lecture WS 2019/2016Bioinformatics IIIDatabase (Oxford). 2015; 2015: bav067. FunctionCountModificationCountDNA modification22DNA methylation7RNA modification30DNA demethylation12Chromatin remodeling101DNA hydroxymethylation5Chromatin remodeling cofactor41RNA degradation9Histone chaperone26mRNA editing10Histone modification15Histone methylation127Histone modification cofactor12Histone acetylation139Histone modification read90Histone phosphorylation55Histone modification write158Histone ubiquitination61Histone modification write cofactor95Histone sumoylation2Histone modification erase66Histone citrullination4Histone modification erase cofactor58TF activator18Polycomb group (PcG) protein29TF repressor27Scaffold protein12TF53

17. Most frequently occurring Pfam domains25. lecture WS 2019/2017Bioinformatics IIIDatabase (Oxford). 2015; 2015: bav067.

18. ENCODE 25. lecture WS 2019/2018Bioinformatics IIIThe ENCODE (Encyclopedia of DNA Elements) Consortium is an international collaboration of research groups funded by the National Human Genome Research Institute (NHGRI). The goal of ENCODE is to build a comprehensive parts list of functional elements in the human genome, including elements that act at the protein and RNA levels, and regulatory elements that control cells and circumstances in which a gene is active.ENCODE consortiumNature 489, 57 (2012)

19. ENCODE: gene expression – TF binding sites 25. lecture WS 2019/2019Bioinformatics IIICorrelative models between TF binding and RNA production in K562 cells. (Left) output of the correlation models (x axis) compared to observed values (y axis). (Right) The bar graphs show the most important TFs.ENCODE consortiumNature 489, 57 (2012)

20. ENCODE: gene expression – histone marks 25. lecture WS 2019/2020Bioinformatics IIICorrelative models between histone marks and RNA production in K562 cells. ENCODE consortiumNature 489, 57 (2012)

21. ChromHMM 25. lecture WS 2019/2021Bioinformatics III- ChromHMM is a software based on a multivariate Hidden Markov Model for learning and characterizing chromatin states. - Input data can be multiple chromatin datasets such as ChIP-seq data of various histone modifications. - The trained ChromHMM model can be used to systematically annotate a genome in one or more cell types. Ernst, Kellis,Nature Methods 9, 215 (2012)Manolis KellisMIT

22. ChromHMM 25. lecture WS 2019/2022Bioinformatics IIIExample of chromatin-state annotation tracks produced from ChromHMM and visualized in the UCSC genome browser.Shown as example is the NFKB1 (subunit of nuclear factor kappa B, this TF controls more than 200 genes).Active promoter, transcription transcription + elongation, insulator before next gene MANBA Ernst, Kellis,Nature Methods 9, 215 (2012)

23. ChromHMM25. lecture WS 2019/2023Bioinformatics III(left) which PTMs contribute to which states.Ernst, Kellis,Nature Methods 9, 215 (2012)(right) Relative percentage of the genome represented by each chromatin state. TSS, transcription start site; TES, transcript end site; GM12878 is a lymphoblastoid cell line.

24. Relate histone modifications to expression25. lecture WS 2019/2024Bioinformatics III(i) Is there a quantitative relationship between histone modifications levels and transcription? (ii) Are there histone modifications that are more important than others to predict transcript levels? (iii) Are there different requirements for different promoter types? (iv) Are the relationships general?The numbers of tags for each histone modification or variant, found in a region of 4,001 base pairs surrounding the transcription start sites of 14,802 RefSeq genes, was used as an estimation of the level of histone modifications. Karlic et al.,PNAS 107, 2926 (2010)Martin VingronMPI Berlin

25. Relate histone modifications to expression25. lecture WS 2019/2025Bioinformatics IIIModels are formulated as equations that linearly relate the levels of histone modifications to the measured expression value. N’i : transformed levels of histone modification i N’i = log(Ni + i) (vector of length L)Ni : number of tags in each promotery : expression values (vector of length L). In the one-modification models, i can be any of the 39 modifications or two control IgG antibodies. In the two-modifications models, i and j cover all combinations of two modifications without repetition. In the three-modifications models, i, j, and k cover all combinations of three modifications without repetition. The full model incorporates all 41 variables.Karlic et al.,PNAS 107, 2926 (2010)

26. Linear model for expression25. lecture WS 2019/2026Bioinformatics IIIPredicted expression values in CD4+ T-cells using the full linear model on the x axis and the measured expression values in CD4+ T-cells on the y axis. The shades of blue indicate the density of points; the darker color, the more points. Red line : linear fit between predicted and measured expression (y = 0.99x + 0.02), which are highly correlated (r = 0.77)→ a quantitative relationship exists between levels of histone modifications at the promoter and gene expression levels(see slide 18 from ENCODE project) Karlic et al.,PNAS 107, 2926 (2010)

27. Linear model for expression25. lecture WS 2019/2027Bioinformatics IIIComparison of prediction accuracy between all possible one-modification, two-modifications, three-modifications models, and the full model for CD4+ T-cells. Models are sorted by ascending prediction accuracy along the x axis. The best models using only a small subset of modifications almost reach the prediction accuracy of the full linear model.Karlic et al.,PNAS 107, 2926 (2010)The top one-modification (rmax = 0.72, H3K27ac), two-modifications (rmax = 0.74, H3K27ac + H4K20me1) and three-modifications models (rmax = 0.75, H3K27ac + H3K4me1 + H4K20me1) are very well correlated to expression.

28. Linear model for expression25. lecture WS 2019/2028Bioinformatics IIIBar plot showing the frequency of appearance of different histone PTMs in best scoring three-modifications models (142 models) for CD4+ T-cells. Best scoring models are defined as reaching at least 95% of prediction accuracy of the full linear model.Not all modifications are equally important, possibly because of a high degree of redundancy.Karlic et al.,PNAS 107, 2926 (2010)

29. Promoter methylation25. lecture WS 2019/2029Bioinformatics IIINext, the authors separated the promoters into 2779 LCPs (low CpG-content promoters) and 7089 HCPs (high CpG-content promoters). Promoters with normalized CpG content > 0.4 are classified as HCP and the others as LCP.This was motivated by the fact that the nucleosomes in HCPs are almost always decorated with H3K4me3, whereas nucleosomes in LCPs carry this modification only when they are expressed. H3K4me3 is thought to be a mark of transcription initiation. The authors reasoned that if these promoters are differently marked by histone modifications then the predictive power of histone modifications should also differ between these two groups of promoters. Derive separate linear models for both groups.Karlic et al.,PNAS 107, 2926 (2010)

30. Linear model for expression25. lecture WS 2019/2030Bioinformatics IIIFrequency of different histone PTMs in best scoring three-modifications models among 50 HCP models and 40 LCP models. Only the top ten modifications are depicted. Karlic et al.,PNAS 107, 2926 (2010)(A) H4K20me1 and H3K27ac (and possibly H2BK5ac) are significantly over-represented among the best scoring models for HCPs (p-values hypergeometric test 9.97e-43, 2.58e-31, and 0.003)(B) H3K4me3 and H3K79me1 are significantly overrepresented in the LCPs (p-values of the hypergeometric test 9.71e-36 and 2.1e-34)→ different modifications are important for the prediction of expression of genes in these two groups.

31. Linear model for expression25. lecture WS 2019/2031Bioinformatics IIIKarlic et al.,PNAS 107, 2926 (2010)Normalized cumulative tag counts in the region of -500 base pairs to 3,000 base pairs surrounding the transcription start site of RefSeq genes in CD4+ T-cells for the 5 important modifications identified by our analysis.H3K4me3, H3K27ac, and H2BK5ac have the highest levels at the promoter, with the highest peaks around 100 base pairs downstream of the TSS. H3K79me1 is enriched along the gene body, and H4K20me1 shows two distinct patterns: a peak close to the promoter at a similar position to H3K4me3 and H3K27ac, and a further enrichment across the gene body region.

32. Test whether model is transferable to other cell types25. lecture WS 2019/2032Bioinformatics IIIKarlic et al.,PNAS 107, 2926 (2010)Apply trained CD4+ model to CD36+ and CD133+ cells.The gene expression profiles of CD36+ and CD133+ cells are highly correlated to CD4+ T-cells (r = 0.79 and r = 0.82, respectively).Thus, he prediction was restricted to genes with a fold change higher than five. They found high correlation of predicted and measured expression values for both CD36+ (r = 0.75) and CD133+ (r = 0.63) cells. This suggests that the relationship between histone modifications and gene expression is general and not dependent on the cellular context.

33. Roadmap: Integrative analysis of 111 epigenomes25. lecture WS 2019/2033Bioinformatics IIIRoadmap Epigenomics ConsortiumNature 518, 317 (2015). How does the epigenomic landscape contribute to cellular circuitry, lineage specification, and the onset and progression of human disease?

34. Mapped modifications25. lecture WS 2019/2034Bioinformatics IIIRoadmap Epigenomics ConsortiumNature 518, 317 (2015). H3K4me3 - associated with promoter regionsH3K4me1 - associated with enhancer regionsH3K36me3 - associated with transcribed regions H3K27me3 - associated with Polycomb repressionH3K9me3 - associated with heterochromatin regions H3K27ac and H3K9ac, associated with increased activation of enhancer and promoter regionsDNase hypersensitivity denoting regions of accessible chromatin commonly associated with regulator binding DNA methylation, typically associated with repressed regulatory regions or active gene transcripts

35. Data sets available for 111 epigenomes25. lecture WS 2019/2035Bioinformatics IIIRoadmap Epigenomics ConsortiumNature 518, 317 (2015).

36. Integrative analysis of 111 epigenomes25. lecture WS 2019/2036Bioinformatics IIIRoadmap Epigenomics ConsortiumNature 518, 317 (2015). Chromatin state annotations across 127 reference epigenomes (rows) in a ~3.5-Mb region on chromosome 9.Promoters are primarily constitutive (i.e. unchanged) (red vertical lines), while enhancers are highly dynamic (dispersed yellow regions).

37. Signal tracks for IMR9025. lecture WS 2019/2037Bioinformatics IIIRoadmap Epigenomics ConsortiumNature 518, 317 (2015). Signal tracks for IMR90 (fetal lung fibroblast) showing RNA-seq, a total of 28 histone modification marks, whole-genome bisulfite DNA methylation, DNA accessibility, digital genomic footprints (DGF), input DNA and chromatin conformation information..

38. Training of recurring 15-states chromatin model25. lecture WS 2019/2038Bioinformatics IIIRoadmap Epigenomics ConsortiumNature 518, 317 (2015).

39. Consisteny of chromatin states across genomic positions25. lecture WS 2019/2039Bioinformatics IIIRoadmap Epigenomics ConsortiumNature 518, 317 (2015). H3K4me1-associated states (including TxFlnk, EnhG, EnhBiv and Enh) are the most tissue specific, with 90% of instances present in at most 5–10 epigenomes, followed by bivalent promoters (TssBiv) and repressed states (ReprPC, Het). In contrast, active promoters (TssA) and transcribed states (Tx, TxWk) were highly constitutive, with 90% of regions marked in as many as 60–75 epigenomes. Quiescent regions were the most constitutive, with 90% consistently marked in most of the 127 epigenomes.

40. Relative switching between states25. lecture WS 2019/2040Bioinformatics IIIRoadmap Epigenomics ConsortiumNature 518, 317 (2015). More frequent switching found between active states and repressed states.This is consistent with activation and repression of regulatory regions.

41. Summary25. lecture WS 2019/2041Bioinformatics IIIRoadmap Epigenomics ConsortiumNature 518, 317 (2015). Combinations of histone modification marks are highly informative of the methylation and accessibility levels of different genomic regions, while the converse is not always true. Genomic regions vary greatly in their association with active marks. Approximately 5% of each epigenome is marked by enhancer or promoter signatures on average, which show increased association with expressed genes, and increased evolutionary conservation.Two-thirds of each reference epigenome on average are quiescent, and enriched in gene-poor and stably repressed regions. Even though promoter and transcription associated marks are less dynamic than enhancer marks, each mark recovers biologically meaningful cell-type groupings when evaluated in relevant chromatin states.