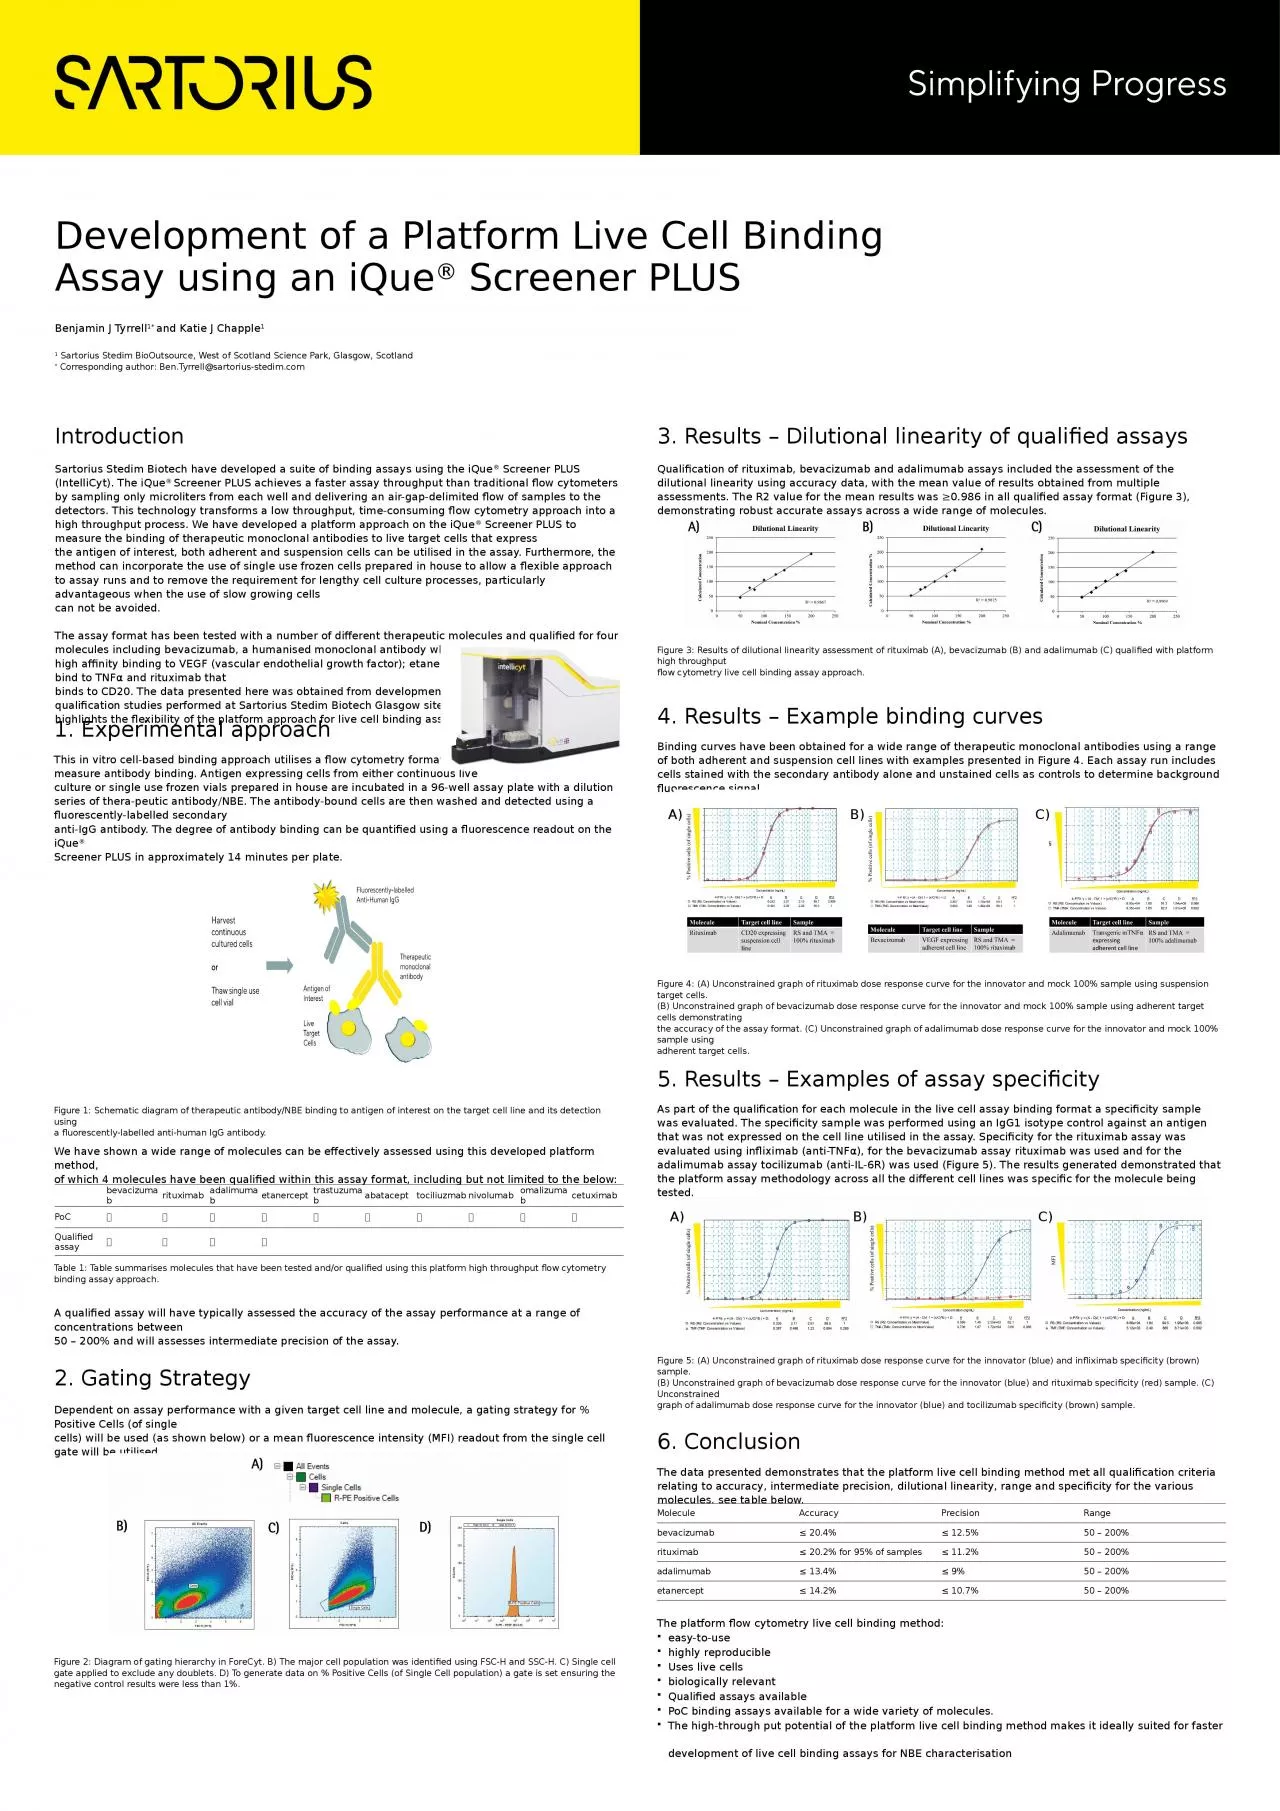
/
Sartorius  Stedim  Biotech have developed a suite of binding assays using the Sartorius  Stedim  Biotech have developed a suite of binding assays using the

Sartorius Stedim Biotech have developed a suite of binding assays using the - PowerPoint Presentation

harper
harper . @harper
Follow
69 views
Uploaded On 2023-11-07

Sartorius Stedim Biotech have developed a suite of binding assays using the - PPT Presentation

iQue Screener PLUS IntelliCyt The iQue Screener PLUS achieves a faster assay throughput than traditional flow cytometers by sampling only microliters from each well and delivering an airgapdelimited flow of samples to the detectors This technology transforms a low throughput ID: 1030098

cell assay cells binding assay cell binding cells platform live antibody sample molecules qualified results rituximab approach specificity assays

Share:

Link:

Embed:

Download Presentation from below link

Download Presentation The PPT/PDF document "Sartorius Stedim Biotech have develope..." is the property of its rightful owner. Permission is granted to download and print the materials on this web site for personal, non-commercial use only, and to display it on your personal computer provided you do not modify the materials and that you retain all copyright notices contained in the materials. By downloading content from our website, you accept the terms of this agreement.


Presentation Transcript

1. Sartorius Stedim Biotech have developed a suite of binding assays using the iQue® Screener PLUS (IntelliCyt). The iQue® Screener PLUS achieves a faster assay throughput than traditional flow cytometers by sampling only microliters from each well and delivering an air-gap-delimited flow of samples to the detectors. This technology transforms a low throughput, time-consuming flow cytometry approach into a high throughput process. We have developed a platform approach on the iQue® Screener PLUS to measure the binding of therapeutic monoclonal antibodies to live target cells that express the antigen of interest, both adherent and suspension cells can be utilised in the assay. Furthermore, the method can incorporate the use of single use frozen cells prepared in house to allow a flexible approach to assay runs and to remove the requirement for lengthy cell culture processes, particularly advantageous when the use of slow growing cells can not be avoided.The assay format has been tested with a number of different therapeutic molecules and qualified for four molecules including bevacizumab, a humanised monoclonal antibody which mediates its activity through high affinity binding to VEGF (vascular endothelial growth factor); etanercept and adalimumab that both bind to TNFα and rituximab that binds to CD20. The data presented here was obtained from development and qualification studies performed at Sartorius Stedim Biotech Glasgow site and highlights the flexibility of the platform approach for live cell binding assays.Qualification of rituximab, bevacizumab and adalimumab assays included the assessment of the dilutional linearity using accuracy data, with the mean value of results obtained from multiple assessments. The R2 value for the mean results was ≥0.986 in all qualified assay format (Figure 3), demonstrating robust accurate assays across a wide range of molecules.IntroductionBenjamin J Tyrrell1* and Katie J Chapple11 Sartorius Stedim BioOutsource, West of Scotland Science Park, Glasgow, Scotland* Corresponding author: Ben.Tyrrell@sartorius-stedim.com3. Results – Dilutional linearity of qualified assaysDevelopment of a Platform Live Cell BindingAssay using an iQue® Screener PLUSThis in vitro cell-based binding approach utilises a flow cytometry format to measure antibody binding. Antigen expressing cells from either continuous liveculture or single use frozen vials prepared in house are incubated in a 96-well assay plate with a dilution series of thera-peutic antibody/NBE. The antibody-bound cells are then washed and detected using a fluorescently-labelled secondaryanti-IgG antibody. The degree of antibody binding can be quantified using a fluorescence readout on the iQue®Screener PLUS in approximately 14 minutes per plate.1. Experimental approachDependent on assay performance with a given target cell line and molecule, a gating strategy for % Positive Cells (of singlecells) will be used (as shown below) or a mean fluorescence intensity (MFI) readout from the single cell gate will be utilised.2. Gating StrategyWe have shown a wide range of molecules can be effectively assessed using this developed platform method,of which 4 molecules have been qualified within this assay format, including but not limited to the below:Figure 1: Schematic diagram of therapeutic antibody/NBE binding to antigen of interest on the target cell line and its detection usinga fluorescently-labelled anti-human IgG antibody.bevacizumabrituximabadalimumabetanercepttrastuzumababatacepttociliuzmabnivolumabomalizumabcetuximabPoCQualified assayTable 1: Table summarises molecules that have been tested and/or qualified using this platform high throughput flow cytometry binding assay approach.A qualified assay will have typically assessed the accuracy of the assay performance at a range of concentrations between50 – 200% and will assesses intermediate precision of the assay.Figure 2: Diagram of gating hierarchy in ForeCyt. B) The major cell population was identified using FSC-H and SSC-H. C) Single cell gate applied to exclude any doublets. D) To generate data on % Positive Cells (of Single Cell population) a gate is set ensuring the negative control results were less than 1%.Figure 3: Results of dilutional linearity assessment of rituximab (A), bevacizumab (B) and adalimumab (C) qualified with platform high throughputflow cytometry live cell binding assay approach.Binding curves have been obtained for a wide range of therapeutic monoclonal antibodies using a range of both adherent and suspension cell lines with examples presented in Figure 4. Each assay run includes cells stained with the secondary antibody alone and unstained cells as controls to determine background fluorescence signal.4. Results – Example binding curvesFigure 4: (A) Unconstrained graph of rituximab dose response curve for the innovator and mock 100% sample using suspension target cells.(B) Unconstrained graph of bevacizumab dose response curve for the innovator and mock 100% sample using adherent target cells demonstratingthe accuracy of the assay format. (C) Unconstrained graph of adalimumab dose response curve for the innovator and mock 100% sample usingadherent target cells.As part of the qualification for each molecule in the live cell assay binding format a specificity sample was evaluated. The specificity sample was performed using an IgG1 isotype control against an antigen that was not expressed on the cell line utilised in the assay. Specificity for the rituximab assay was evaluated using infliximab (anti-TNFα), for the bevacizumab assay rituximab was used and for the adalimumab assay tocilizumab (anti-IL-6R) was used (Figure 5). The results generated demonstrated that the platform assay methodology across all the different cell lines was specific for the molecule being tested.5. Results – Examples of assay specificityFigure 5: (A) Unconstrained graph of rituximab dose response curve for the innovator (blue) and infliximab specificity (brown) sample.(B) Unconstrained graph of bevacizumab dose response curve for the innovator (blue) and rituximab specificity (red) sample. (C) Unconstrainedgraph of adalimumab dose response curve for the innovator (blue) and tocilizumab specificity (brown) sample.The data presented demonstrates that the platform live cell binding method met all qualification criteria relating to accuracy, intermediate precision, dilutional linearity, range and specificity for the various molecules, see table below.6. ConclusionThe platform flow cytometry live cell binding method:easy-to-usehighly reproducibleUses live cellsbiologically relevantQualified assays availablePoC binding assays available for a wide variety of molecules.The high-through put potential of the platform live cell binding method makes it ideally suited for faster development of live cell binding assays for NBE characterisationMoleculeAccuracyPrecisionRangebevacizumab≤ 20.4% ≤ 12.5% 50 – 200%rituximab≤ 20.2% for 95% of samples ≤ 11.2% 50 – 200%adalimumab≤ 13.4% ≤ 9% 50 – 200%etanercept≤ 14.2% ≤ 10.7% 50 – 200%A)B)C)A)B)C)