/
Good Practice Guidance and Uncertainty Management in National Greenhou Good Practice Guidance and Uncertainty Management in National Greenhou

Good Practice Guidance and Uncertainty Management in National Greenhou - PDF document

jane-oiler
jane-oiler . @jane-oiler
Follow
422 views
Uploaded On 2015-08-13

Good Practice Guidance and Uncertainty Management in National Greenhou - PPT Presentation

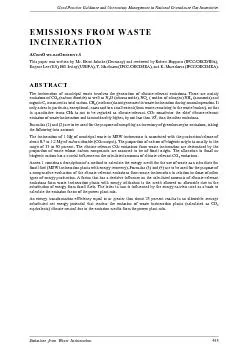
EMISSIONS FROM WASTE INCINERATION CKNOWLEDGEMENTSThis paper was written by Mr Bernt Johnke Germany and reviewed by Robert Hoppaus IPCCOECDIEA Background Paper Waste Sector 456 1 NATURE MAGN ID: 106285

EMISSIONS FROM WASTE INCINERATION CKNOWLEDGEMENTSThis

Share:

Link:

Embed:

Download Presentation from below link

Download Pdf The PPT/PDF document "Good Practice Guidance and Uncertainty M..." is the property of its rightful owner. Permission is granted to download and print the materials on this web site for personal, non-commercial use only, and to display it on your personal computer provided you do not modify the materials and that you retain all copyright notices contained in the materials. By downloading content from our website, you accept the terms of this agreement.


Presentation Transcript

Good Practice Guidance and Uncertainty Management in National Greenhouse Gas Inventories Emissions from Waste Incineration EMISSIONS FROM WASTE INCINERATION CKNOWLEDGEMENTSThis paper was written by Mr. Bernt Johnke (Germany) and reviewed by Robert Hoppaus (IPCC/OECD/IEA), Background Paper Waste Sector 456 1 NATURE, MAGNITUDE AND DISTRIBUTION 1.1 Waste incineration The role of waste incineration differs in the countries of the world. While in the industrialised countries in Europe as well as in Japan, the USA and Canada the proportion of waste burned in waste incineration plants can be very high (up to 100 percent), in most developing countries landfilling is the more common waste management practice. 1.1.1 Status of waste incineration in the various EU member The role of municipal waste incineration in European countries varies from country to country. The compilation presented below (Table 1) shows the amounts of municipal waste incinerated in waste incineration plants of countries in western Europe. It has been taken from an EU report on waste incineration which has been prepared for the European Commission by the Netherlands-based TNO, with 1993 as the reference year. The figures for Germany, Portugal, Luxembourg and Austria have been updated to reflect the status in 1998. TATUS OF THE INCINERATION OF SOLID WASTE IN UROPE Country Incineration capacity per country 10 /y share of incineration No of MSW incinerators Austria 0.513 20% Belgium 2.24 35% Denmark 2.31 75% Finland 0.07 4% France 11.33 45% Greece 0 - 0 Germany 14 32% Ireland 0 - 0 Italy 1.9 7% Luxembourg 0.125 95% Netherlands 3.15 27% Norway 0.5 n.d. 18 Portugal 0.5 n.d. 2 Spain 0.74 5% Sweden 1.86 40% Switzerland 2.84 100% UK 3.67 2% West-Europe total 45.748 - 497 EU total 42.408 - 449 The compilation presented below (figure 1) shows that the calorific values of mixed municipal solid waste in other countries differ very much and range from 3,500 to 15,000 kJ/kg. Good Practice Guidance and Uncertainty Management in National Greenhouse Gas Inventories Emissions from Waste Incineration Source: Martin GmbH, München company brochure “Thermische Behandlung undenergetische Verwertung von Abfall”, page 5, 1997SWISSUSAEUROPE without SwissJAPANSINGAPURTAIWANBRAZILKOREACHINACalorific values of municipal solid waste in other CountriesFigure 1 Compilation of calorific values from MSW in different countries 1.1.2 MSW incineration in Europe (example Germany) The thermal treatment of solid municipal waste mostly takes place in plants equipped with grate firing systems, in individual cases, in pyrolysis, gasification or fluidized bed plants or in plants using a combination of these process stages. Residual municipal waste (domestic refuse, commercial waste similar to domestic refuse, bulky waste, road sweepings, market waste, etc.) is delivered to grate furnaces as a heterogeneous mixture of wastes. Combustible components account for a content of about 40 - 60 wt. percentage. Since the municipal waste incinerated is a heterogeneous mixture of wastes, in terms of sources of CO a distinction is drawn between carbon of biogenic and carbon of fossil origin. The calorific value of mixed waste ranges from 7,500 to 11,000 kJ/kg. The waste's carbon content is generally in the range of 28 - 40 wt. percent (averages, related to dry matter). Treatment in incineration plants is an output-controlled process (geared, as a rule, to steam output). The combustion temperature of the gases in the combustion chamber as measured for at least two seconds after the last injection of combustion air is usually at least 850°C. The oxygen necessary for incineration is supplied via ambient air, as primary, secondary and/or tertiary air. The volume of air supplied to the incinerator is between 3,000 and 4,500 m (dry) per Mg of waste. This gives a waste gas volume of 3,500 - 5,500 m (dry) per Mg of waste. At almost all municipal waste incineration plants, the heat produced during incineration is utilised for steam generation. Upon reaching the end of the steam generator, the temperature of the waste gas has been reduced to 200° C. The steam produced in municipal waste incinerators exhibits pressures between 14 and 120 bar and temperatures between 196 and 525°C. Common steam parameters are 40 bar and 400°C. A high heat utilisation efficiency can only be achieved if incineration is controlled so that the produced amounts of steam can be made available continuously for direct supply of heat and electricity to an industrial plant or for use in a heating station or cogeneration plant. 1.1.3 Hazardous waste incineration in Europe (example Germany) Hazardous waste is treated almost exclusively by incineration. Incineration must be understood here as an element of comprehensive logistics for the treatment of those wastes which due to their harmful nature have to be managed separately from municipal waste. Hazardous waste is waste requiring particular supervision, which by its nature, condition or amount poses a particular hazard to health, air and/or water or is particularly explosive, or may contain or bring forth pathogens of communicable diseases. Since hazardous waste is generated for the most part in industrial production, notably the chemical industry, it is also referred to as industrial waste or industrial residue. Hazardous wastes occur, for example, as residues from petrochemical distillation processes, as undesirable by-products of syntheses processes of the basic organic chemical industry and the pharmaceutical industry as well Background Paper Waste Sector 458 as in the recovery and disposal of contaminated or post-expiration-date products such as solvents, paints or waste oil. In addition, environmental protection measures such as regulations prohibiting PCBs, CFCs or halons may generate streams of hazardous waste. The waste going to incineration is usually a mixture of waste types which may differ in composition and be present in solid, semi-liquid or liquid form. Its chemical description differs from that of municipal waste. As hazardous wastes are of varying consistency, the rotary kiln is widely used as a universally applicable incineration process. Only in exceptional cases are hazardous wastes incinerated in a conventional combustion chamber, a muffle-type furnace or other type of incineration system. The rotary kiln operates according to the parallel-flow principle, in which the material being incinerated and the combustion gas are transported in the same direction, from the cold to the hot side. With combustion temperatures between 800 and 1200°C, the residence time of solids in the rotary kiln is up to 1 hour while for the combustion gases it is only a few seconds. The waste gas generated during the combustion process is fed to an after burning chamber, in which the minimum temperature of between 850 and 1200°C is maintained for a residence time of at least 2 seconds. The waste gas volume from this process is generally assumed to be about 7,000 m (dry) per Mg of waste. At nearly all hazardous-waste or residues incineration plants, the heat produced during incineration is utilised for steam generation downstream from the afterburner. Upon reaching the end of the steam generator, the temperature of the waste gas has been reduced to 200-300°C. The steam from hazardous-waste incineration exhibits pressures between 17 and 30 bar and temperatures between 250 and 300°C. 1.1.4 Mono-incineration of sewage sludge in Europe (example Germany) The system mainly used for the incineration of sewage sludge is fluidized-bed combustion. Most plants are stationary fluidized-bed furnaces, but there are also multiple-hearth furnaces and multiple-hearth fluidized-bed furnaces in use. Fluidized-bed furnaces for the incineration of sewage sludge are usually operated at combustion temperatures in the range of 850°C and 900°C. The waste gas volume from this process is generally assumed to be about 8,000 m (dry) per Mg. of sewage sludge (dry matter). Modern plants are equipped with a steam generator downstream from incineration, producing wet steam with a pressure of 10 bar and a temperature of 180°C. Most plants use the produced steam to meet in-plant requirements (e.g. for sludge drying). The sewage sludge delivered to the incineration plants in de-watered and/or partially dried condition usually has a water content of 50-70 percent. The calorific value of de-watered sludge averages 3,500 kJ/kg in the case of raw sludge (25 percent dry matter) and 2,500 kJ/kg in the case of digested sludge (25 percent dry matter). The content of mineral and inorganic components in sludge can be as high as 30 percent. The carbon content of sludge is generally about 30 percent. 1.1.5 Co-incineration in Europe In the future, the use of waste in plants other than waste incineration plants will be gaining in importance as a waste management option. The object of co-incinerating high-calorific waste as substitute fuel (so-called waste for energy recovery) in production (e.g. cement works, brick manufacture, blast furnace), power plants (e.g. use of sewage sludge in coal-fired power plants) and industrial boilers is the substitution of regular fuel (coal, fuel oil, etc.) and to reduce energy costs. The climate-relevant emissions of a waste incineration plant are made up of a proportion to be allocated to the waste's contribution to the thermal output and that of the remaining regular fuel. Therefore, a proportions calculation has to be carried out to determine the proportion of those climate-relevant emissions which result from the co-incineration of the waste. 1.1.6 Other kinds of waste incineration In most European countries, the use of incineration plants for medical waste or as crematoria is for the combustion capacity and the climate-relevant emission of flue gas stream not so relevant. For that reason this kind of incineration will not be considered in this paper.(From a waste management perspective, merely dividing the total CO load produced by a waste incineration plant into carbon compounds of biogenic and carbon compounds of fossil origin is too simple a view. It fails to take into account that waste of biogenic origin. It includes a fossil component from the product life-cycle. That component stems from manufacture and transport (e.g. of textiles, paper and cardboard, composites, wooden furniture bulky waste) and needs to be allocated and charged to the product/waste fraction as climate-relevant. When reporting emissions according to the Revised 1996 IPCC Guidelines for National Greenhouse Gas for National Inventories (IPCC Guidelines) however, these emissions are included in the energy sector and should therefore not be included in the waste emission.) Good Practice Guidance and Uncertainty Management in National Greenhouse Gas Inventories Emissions from Waste Incineration 2 METHODOLOGICAL ISSUES 2.1 Proposed methodology to calculate the emissions from waste incineration (The values of the calculation shall be standardised on the following conditions: dry gas, 11 percent O, 273 K, 1013 hPa). Equation 1 calculates the emissions from waste incineration plants: QUATION Emissions i [Mg ] = emission concentration i [Mg exhaust gas volume (dry) [m/Mg waste] amount of incinerated waste [Mg waste] Where: Emission i in [Mg emission] CO, NOx, CO, TOC, NHemission concentration i [Mg  10] of the climate-relevant emission according to chapter 2.2 CO, NOx, CO, TOC, NHexhaust gas volume (dry) [m/Mg waste] of the incineration plant according to chapter 2.4 amount of incinerated waste [Mg waste] of a country per year. Equation 2 calculates the emissions in CO-equivalent: QUATION Emissions in CO-equivalent i [Mg CO] = Emission i [Mg emission] GWP [Mg CO/Mg emission] Where: Emissions in CO-equivalent i [Mg COEmission i [Mg emission] of Formula (1) CO, NOx, CO, TOC, NHglobal warming potential GWP in [Mg CO/Mg emission] according to chapter 2.3 2.2 Choice of emission factor and activity data Carbon Dioxide COThe incineration of 1 Mg of municipal waste in MSW incinerators is associated with the production/release of about 0.7 to 1.2 Mg of carbon dioxide CO. Although this carbon dioxide is directly released into the atmosphere and thus makes a real contribution to the greenhouse effect, only the climate-relevant CO emissions from fossil sources are considered for the purposes of a global analysis. Since the municipal waste incinerated is a heterogeneous mixture of wastes, in terms of sources of CO a distinction is drawn between carbon of biogenic and carbon of fossil origin. In the literature, the proportion of CO assumed to be of fossil origin (e.g. plastics) and consequently to be considered as climate-relevant, is given as 33 to 50 percent. Assuming that carbon dioxide emissions from MSW incineration average 1 Mg per Mg of waste, then of these COemissions 0.33 (0.50) Mg are of fossil and 0.67 (0.50) Mg are of biogenic origin. In subsequent calculations, the proportion of climate-relevant CO is figured out as an average value of 0415 Mg of CO per Mg of waste. The measured CO output content of the exhaust gas (dry) in MSW incineration plants is round about 10 Vol. percent multiply with 5,500 m exhaust gas volume (dry) per Mg waste multiply with 1.9768 kg/ m density of CO result in 1087 kg CO per Mg waste. The content of C in CO is round about 27.3 percent resulting in 297 kg C per Mg waste. Another way to develop the estimate of climate-relevant CO emission from the input, was to estimate the amount of non-biogenic carbon in the waste. Usually, three waste categories contain non-biogenic carbon: plastics, textiles, and a combined category for rubber and leather (U.S. EPA 1997).But it is a problem to determine the real Background Paper Waste Sector 460 content of carbon in the heterogeneous MSW, because it is variable from day to day. The waste's carbon content of German MSW is generally in the range of 28 - 40 wt .percent (averages, related to dry matter) or 280 - 400 kg C per Mg waste. Calculation example (Germany MSW incinerated 14 Mg waste/ year): Equation 1: Total Emission CO = 0.415 Mg CO /Mg waste Mg waste/ year Total Emission CO = 5.81 Mg/year Equation 2: Total emission CO = 5.81 Mg CO /year For the incineration of sewage sludge in fluidized-bed plants, an emission of 1 Mg of CO per Mg of incinerated sludge (dry matter) is assumed. Nitrous Oxide NAs well as the above nitrogen oxide compounds NO and NO, nitrous oxide NO is of relevance from a climate perspective. Emission levels of 1 to 12 mg/m have been determined in individual measurements at MSW incineration plants, with an average of 1 - 2 mg/m. From hazardous waste incineration plants the emission levels of 30 to 32 mg/m have been determined in individual measurements. emission levels (individual measurements) are markedly higher in the incineration of sewage sludge in fluidized-bed plants. An average of 100 mg N was used for the calculations presented here. Calculation example Equation 1: Total Emission NO = 2 mg/m 5,500 Nm /Mg waste 14 Mg waste/year Total Emission NO = 154 Mg/year Equation 2: Total emission CO-equivalent = 154 Mg NO/y 310 Mg CO /Mg NTotal emission CO-equivalent NO = 0.04774 10 Mg CO /year Methane CHIt can be assumed that under the oxidative combustion prevailing in waste incineration in MSW incinerators, methane is not present in the waste gas and consequently is not emitted. Although methane emissions may form in the waste bunker, the underpressure in the waste bunker causes them to be transported with the bunker air to the combustion chamber as primary air, to be converted there. Calculation example Equation 1: Total Emission CHEquation 2: Total emission CO-equivalent CH2.2.1 Other climate-relevant emissions from MSW incineration (NOT relevant for IPCC methodology) Carbon Monoxide CO During the incineration of municipal waste in MSW incinerators carbon monoxide is formed as the product of incomplete combustion. CO is an indicator substance for the combustion process and an important quality criterion for the level of combustion of the gases. As a rule, CO is measured continuously in the plants. Average CO emissions, as daily means, are below 50 mg/ m. Plants reflecting BAT (Best Available Techniques) have daily means in the range of mg/ m Good Practice Guidance and Uncertainty Management in National Greenhouse Gas Inventories Emissions from Waste Incineration Calculation example Equation 1: Total Emission CO = 50 mg/m 5,500 Nm /Mg waste 14 Mg waste/year Total Emission CO= 3.85 10 Mg/year Equation 2: Total emission CO-equivalent = 3.85 10 Mg CO/y 3 Mg CO /Mg CO Total emission CO-equivalent CO = 0.01155 Mg CO /year Nitrogen Oxides NOIn the incineration of municipal waste in MSW incinerators nitrogen oxides NOx (NO, NO) arise, which are formed essentially from the nitrogen contained in the waste, from the combustion process itself and from spontaneous reaction (so-called prompt NOx). As a rule, nitrogen oxide concentrations in waste gas are measured continuously at these plants. If no measures were performed at MSW incinerators for nitrogen removal, the emissions would be between 350 and 400 mg/m. An emission level of 200 mg/m can safely be attained if selective waste gas treatment measures are carried out (SNCR, SCR). Plants reflecting BAT (best available techniques) attain emission levels in the range of 100 to 150 mg NOx/mwhen using SNCR technology and 70 mg NOx/m when using SCR technology. Hazardous waste incineration plants reflecting BAT attain emission levels in the range of 40 to 50 mg NOx/mwhen using SCR technology. Calculation example Equation 1: Total Emission NO mg/m 5,500 Nm /Mg waste Mg waste/year Total Emission NO Mg/year Equation 2: Total emission CO-equivalent = 15.4 10 Mg NO/y 8 Mg CO /Mg NOTotal emission CO-equivalent NO = 0.123 Mg CO /year Ammonia NHIn MSW combustion, emissions of ammonia NH arise in particular from the use of ammonia (and also ammonia water) as an additive in waste gas treatment measures for nitrogen removal (SNCR, SCR). As a rule, emissions (determined in individual measurements) are in the range of 1-10 mg/m; the average is assumed to be 4 mg NHCalculation example Equation 1: Total Emission NH = 4 mg/m 5,500 Nm /Mg waste 14 Mg waste/year Total Emission NH = 308 Mg/year Equation 2: Total emission CO-equivalent NH = n.d.Non-Methane Volatile Organic Compounds ( NMVOCs) Organic compounds (organic C) in the waste gas of MSW incineration plants are measured continuously as sum parameter Total Carbon. This parameter constitutes an indicator of the level of combustion achieved in an incineration process. The emissions are subject to a limit of 10 mg/ m, but BAT plants attain, as a rule, emission levels of 1 mg/ mCalculation example TOC: Equation 1: Total Emission TOC= 5 mg/ m 5,500 N m /Mg waste 106 Mg waste/year Total Emission TOC= 385 Mg/year Background Paper Waste Sector 462 Equation 2: Total emission CO-equivalent = 385 Mg TOC/y 11 Mg CO /Mg TOC Total emission CO-equivalent TOC = 0.004235 106 Mg CO /year 2.3 Estimation of the specific emissions of a power plant mix per kWh Net (related to total electricity consumption) and the global warming potential (GWP) The specific emissions data, in mg/kWh, refer to the total amount of electricity produced in all public power plants, based on a power plant mix consisting of fossil-fuelled power plants (gas, oil, coal), nuclear power plants and power plants operated with renewable energy sources (hydro, wind, solar). They are used to make a global estimate at country level (in the present case, Germany) of the specific climate-relevant emissions from the power plant sector. For local-level analyses, instead of the electricity-related power plant mix more specific emission factors (related to the energy carrier actually being replaced) should be used in the calculations to determine the substitution effect of energy produced in waste incineration (Table 2). MISSION FACTORS FOR POWER PLANT MIX Emission Emission factor (power plant mix) mg/kWhGWP (100 years) kg CO/kg emission 690,000 1 O 32 310 CO 235 3 NMVOC 13 11 7 not defined 660 8 13 21 2.4 Exhaust gas volumes in waste incineration Waste incineration plants have different exhaust gas volumes. This depends on the kind of the process and the composition of waste. Table 3 shows the usual exhaust gas volumes in MSW incineration plants, hazardous waste incineration plants and mono-sewage sludge incineration plants. IFFERENT EXHAUST GAS VOLUMES IN WASTE INCINERATION PLANTS Exhaust gas volume (dry) Municipal solid waste incineration 5,500 m/Mg waste dous waste incineration 7,000 m/Mg waste Mono sewage sludge incineration 8,000 m /Mg sewage sludge dry matter 3 REPORTING AND DOCUMENTATION Transparency will be improved if all countries report estimates for their waste incineration activities separately, and indicate whether they use Tier 1, Tier 2, or Tier 3 methods. Good Practice Guidance and Uncertainty Management in National Greenhouse Gas Inventories Emissions from Waste Incineration 4 INVENTORY QA/QC 4.1 Internal inventory QA/QC systems Quality of the data used to calculate climate-relevant emissions: Tier 1 Emissions data for the waste gas parameters NO, CO, Total Organic Carbon are determined by continuous measurements in the waste incineration plants, monitored by the competent licensing authorities and published on a yearly basis. Municipal solid waste is heterogeneous (a composite of many waste components). A determination of the climate-relevant chemical substances contained in the waste input, cannot be specifically stated, due to the fact that MSW analysis can only make individual conclusion and not general statements (due to their permanent changing as non-homogenous composition). The method proposed here for estimation of the climate-relevant total emissions is therefore based on exhaust gas measurements. These output measurements can be more exactly defined as the waste input analysis. Tier 2 Emissions data for the waste gas parameter CO are calculated on the basis of waste analyses, and emissions data for NH and NO are determined by individual measurements. Tier 3 The specific emissions factors, related to electricity consumption, for climate-relevant emissions of the power plant mix have been calculated on the basis of energy statistics and annual reports of the energy industry. The specific waste gas volumes generated in the various treatment processes have been calculated from the operators' dataon waste gas volume and the associated waste throughputs. Uncertainty is involved in determining the proportion of climate-relevant CO from waste incineration for the purpose of calculating total climate-relevant emissions, since the range of variation in the proportion of CO from waste of biogenic origin leaves ample scope for subjective judgement. One has to largely draw upon literature data from analyses for the carbon content in waste, its distribution among the various waste fractions, associated assumptions with respect to waste composition, and estimates based thereon. The results of the calculation in Annex 1 shows, that the determination of the energy actually substituted in a country by waste incineration is likewise subject to a great deal of uncertainty. Energy-related data (calorific value of the waste, utilisation of waste-derived energy) and possible efficiencies vary widely. They are determined by the site conditions and the geographical location, and have a considerable influence on the energy credits to be deducted from the total emissions determined. The comparison of the total emissions calculated according to formulas (1) and (3) allows a criterion to be obtained for the assessment of modern waste incineration with and without energy use which takes into account the substituted primary energy potential. Using the climate-relevant CO equivalents calculated according to formulas (2) and (4), the climate-relevant emissions of waste incineration plants can be added up as CO equivalents to enable an overall assessment. constitutes the chief climate-relevant emission of waste incineration and is considerably higher, by not less than 10, than the other emissions. An energy transformation efficiency equal to or greater than about 25 percent results in an allowable average substituted net energy potential that renders the emission of waste incineration plants (calculated as COequivalents) climate-neutral due to the emission credits from the power plant mix. The incineration of municipal waste involves the generation of climate-relevant emissions. These are mainly emissions of CO, but also of NO, NO, and organic C, measured as total carbon. CH is not generated in waste incineration during normal operation. It only arises in particular, exceptional, cases and to a small extent (from waste remaining in the waste bunker), so that in quantitative terms CH is not to be regarded as climate-relevant. In waste incineration plants, CO constitutes the chief climate-relevant emission and is considerably higher, by not less than 10, than the other climate-relevant emissions. In Germany the incineration of 1 Mg of municipal waste in MSW incinerators is associated with the production/release of about 0.7 to 1.2 Mg of carbon dioxide (CO output). The proportion of carbon of biogenic Background Paper Waste Sector 464 origin is usually in the range of 33 to 50 percent. The climate-relevant CO emissions from waste incineration are determined by the proportion of waste whose carbon compounds are assumed to be of fossil origin. The allocation to fossil or biogenic carbon has a crucial influence on the calculated amounts of climate-relevant CO emissions. In Germany, every waste incineration plant is equipped with facilities to utilize energy. A factor that has a decisive influence on the calculated amounts of climate-relevant emissions from waste incineration plants with energy utilisation is the credit allowed or allowable due to the substitution of energy from fossil fuels. The latter in turn is influenced by the energy carriers used as a basis to calculate the emission factor of the power plant mix. An energy transformation efficiency equal to or greater than about 25 percent results in an allowable average substituted net energy potential that renders the emission of waste incineration plants (calculated as COequivalents) climate-neutral due to the emission credits from the power plant mix. REFERENCES Energy from waste plants 1994, General/Technical Information, ISWA Working group on thermal treatment of waste, December 1994, ISWA General Secretariat DK-1069 Copenhagen K, Denmark, reporter for Germany: Dr. D.O. Reimann, Bamberg, Pages 39-52 EU Report: Economic Evaluation of the Draft Incineration Directive, A report produced for the European Commission DGXI, Contract No. B4 3040/95/001047/MAR/B1, December 1996, ETSU Reimann, D.O., Hämmerli, H.: "Verbrennungstechnik für Abfälle in Theorie und Praxis”, Schriftenreihe Umweltschutz, Bamberg 1995, Ed.: Dr. D.O. Reimann, Rheinstr. 6, D-96052 Bamberg Wallmann, R.: "Ökologische Bewertung der mechanisch-biologischen Restabfallbehandlung und der Müllverbrennung auf Basis von Energie- und Schadgasbilanzen”, Schriftenreihe des Arbeitskreises für die Nutzbarmachung von Siedlungsabfällen (ANS) e.V., ISBN 3-924618-37-2, Vol. 38, April 1999, D-40822 Mettmann Good Practice Guidance and Uncertainty Management in National Greenhouse Gas Inventories Emissions from Waste Incineration ANNEX 1 METHOD FOR CALCULATION OF ENERGY CREDIT FOR USE OF MSW AS A SUBSTITUTE FOR Discription of a method to calculate the energy credit for the use of waste as a substitute for fossil fuel (MSW incineration plants with energy recovery) A 1.1 Formulas to calculate the energy credit for the use of waste as a substitute for fossil fuel (MSW incineration plants with energy recovery) Equations 3 and 4 are to be used for the purpose of a comparative evaluation of the climate-relevant emissions from waste incineration in relation to those of other types of energy production. A factor that has a decisive influence on the calculated amounts of climate-relevant emissions from waste incineration plants with energy utilisation is the credit allowed or allowable due to the substitution of energy from fossil fuels. The latter in turn is influenced by the energy carriers used as a basis to calculate the emission factor of the power plant mix. Equation 3 corrects the total emissions from Equation 1 for the use of waste as substitute fuel (for incineration plants with energy recovery): QUATION Total emission [Mg emission] = total emission [Mg emission] - usable/used energy [kWh] emission factor (power plant mix) [Mg emission /kWh] Where: Total emission in [Mg emission] for incineration plants with energy recovery COO, NOx, CO, TOC, CHtotal emission [Mg emission] of Formula (1) COO, NOx, CO, TOC, CHusable/used energy [kWh] different for every country according to A 1.2 and A 1.3 in this annex. emission factor (power plant mix) [Mg emission /kWh] for the climate-relevant emissions of substituted energy from fossil fuel according to chapter 2.3 Equation 4 adds the calculated correct climate-relevant total emission as CO-equivalent (for incineration plants with energy recovery): QUATION Total emission CO-equivalent [Mg CO] = total emission [Mg emission] GWP [Mg CO/Mg emission] Where: Total emission CO-equivalent [Mg COtotal emission [Mg emission] from Formula (3) global warming potential (GWP) [Mg CO/Mg emission] according to chapter 2.3 Calculation example CO 2 : Equation 3: Total Emission COcor = 5.81 Mg /year - 8.75 kWh/year 690,000 mg CO /kWh Total Emission CO = 5.81 Mg CO /year - 6.0375 Mg CO /year (energy credit) Total Emission CO = - 0.2275 Mg CO /year Equation 4: Total emission COcor = - 0.2275 Mg CO /year Background Paper Waste Sector 466 Calculation example Equation 3: Total Emission NO= 15.4 Mg/year - 8.75 kWh/year 660 mg NO/kWh Total Emission NOcor = 15.4 Mg /year - 5.775 Mg/year (energy credit) Total Emission NO = 9.625 Mg NOx/year Equation 4: Total emission CO-equivalent NO = 9.625 Mg NOx/year 8 Mg CO /Mg NOx Total emission CO-equivalent NO = 0.077 Mg CO /year Calculation example N 2 O : Equation 3: Total Emission Nco r = 154 Mg /year - 8.75 kWh/year 32 mg NO /kWh Total Emission Ncor = 154 Mg /year - 280 Mg /year (energy credit) Total Emission N cor = -126 Mg/year Equation 4: Total emission CO-equivalent N cor = - 126 Mg NO /year 310 Mg CO /Mg N Total emission CO-equivalent N cor = - 0.03906 Mg CO /year Calculation example CO : Equation 3: Total Emission COcor = 3.85 Mg/year - 8.75 kWh/year 235 mg CO/kWh Total Emission CO = 3.85 Mg/year - 2.05 Mg/year (energy credit) Total Emission CO = 1.8 Mg/year Equation 4: Total emission CO-equivalent COMg CO/year 8 Mg CO /Mg CO Total emission CO-equivalent CO Mg CO /year Calculation example TOC: Formula (3) Total Emission TOCco r = 385 Mg /year - 8.75 kWh/year 13 mg TOC/kWh Total Emission TOC = 385 Mg /year - 113.75 Mg /year (energy credit) Total Emission TOC = 271.25 Mg/year Formula (4) Total emission CO-equivalent TOC = 271.25 Mg TOC/year 8 Mg CO /Mg TOC Total emission CO-equivalent TOC = 0.002983 Mg CO /year Good Practice Guidance and Uncertainty Management in National Greenhouse Gas Inventories Emissions from Waste Incineration Calculation example NH 3 Equation 3: Total Emission NH3 cor = 308 Mg /year - 8.75 kWh/year 7 mg NH/kWh Total Emission NH = 308 Mg /year - 61.25 Mg /year (energy credit) Total Emission NH = 246.75 Mg/year Formula 4: Total emission CO-equivalent NH = n.d Calculation example CH 4 Equation 3: Total Emission CH4 = 0 - 8.75 kWh/year 13 mg CH/kWh Total Emission CH4 = 0 - 113 Mg/year Total Emission CH = - 113 Mg/year Equation 4: Total emission CO-equivalent CH = - 113 Mg CH/year 21 Mg CO /Mg CH Total emission CO-equivalent CH = - 0.002373 Mg CO /year A1.2 Energy utilisation efficiency of (energy supplied by) different MSW incineration plants In general, about 300 to 600 kWh of electricity can be produced in a MSW incineration plant from 1 Mg of municipal waste, depending on plant size, steam parameters and steam utilisation efficiency. In the case of the co-generation of electricity and heat, about 1,250 kWh of heat per Mg of waste can be produced in addition and supplied to external users, depending on the incineration plant's site-dependent heat supply opportunities as well as the geographical location of the country and the (long-distance) heat utilisation periods usual for that country (e.g. in Germany, 1,300-1,500 hrs/year out of a possible 8,760 hrs/year). Given ideal site conditions with favourable opportunities for utilisation and supply in the form of steam, electricity and hot water or exclusively steam, the transformation/recovery efficiency of an incineration plant operating at base load can be increased to a maximum of 75-83 percent of the energy input (calorific value). In this energetically favourable case, about 2 MWh, as energy mix (electricity and heat), per Mg of waste can be produced and supplied to external users. Actual energy transformation efficiencies are shown in the Table 4 below, ranging from a site with minimum supply of energy (electricity only) to sites with normal or optimised power/heat co-generation or exclusively supplying heat. This broad range of variation among existing plants illustrates that the energy transformation efficiency as well as the proportion of energy actually supplied by waste incinerators to substitute for fossil energy sources, as estimated on the basis of it, and the resultant emissions, are of major importance to the calculation of climate-relevant emissions. NERGY TRANSFORMATIONRECOVERY EFFICIENCIES (W) OF THE GROSS ENERGY INPUT OF INCINERATORS minimum energy recovery normal energy recovery optimised energy recovery optimised energy recovery W thermal (%) 1 11 15 - 55 70-83 W electrical (%) 13 14 20 0 W total (%) 13 25 35 - 75 70-83 A1.3 Status of Waste Incineration and Energy Use in Germany In Germany an amount of approx. 14 10 Mg/a of residual waste is subjected to thermal treatment (status: 1999). For waste incineration plants in Germany, a theoretical gross energy content in municipal waste, in kJ/a, can be specified by multiplying an assumed average calorific value of about 9 kJ per Mg of waste, roughly reflecting as a rule the calorific value of low-quality lignite, by the amount of waste incinerated annually. From this, the Background Paper Waste Sector 468 energy made available by waste incineration can be calculated as a function of the assumed energy transformation and utilisation efficiency (the average from all plants in Germany is in the range of 20 to 35 percent) to derive conclusions as to the relevance of waste-derived energy for the substitution of climate-relevant emissions from fossil energy sources. The waste incineration plant's own energy (electricity, etc.) requirements (e.g. for waste gas treatment) are considered to be external energy which in the ideal case would be met through in-plant electricity production. Taking Germany as an example, the credit for energy from waste incineration is calculated as follows: Amount of residual waste subjected to thermal treatment: approx. 14 Mg/a, multiplied by an average calorific value of approx. 9 kJ/Mg waste gives 126 kJ, or 126 GJ/a; divided by 3.6 GJ/MWh gives 35 MWh/a. Of this amount, an average of 35 MWh/a 0.25 total energy transformation efficiency is utilised, which brings the average allowable substituted net energy potential to 8.75 MWh/a (normal energy recovery). Based on 1992 operating data taken from the ISWA's data compilation "Energy from Waste Plants 1994", the energy supplied to external users in the form of heat and electricity by waste incineration plants in Germany (incineration capacity 7.3 Mg/a) can be calculated at approx. 4.8 MWh/a. If the total emission of the non-biogenic CO is estimate with 0.414 Mg CO per Mg waste and the average total energy transformation efficiency of all waste incineration plants with energy recovery were optimised to reach a value equal to or greater than about 0.25, the allowable substituted net energy potential would increase to 8.75 MWh/a (normal energy recovery), leading to neutrality in climate-relevant emissions from waste incineration due to the emission credits from the power plant mix. A 1.4 Comparison example of the climate-relevant total emission from MSW Incineration in Germany with or without energy recovery Results of the amount of calculation from Equations 1, 2, 3, and 4 - Table 5 constitutes the chief climate-relevant emission of waste incineration and is considerably higher, by not less than 10, than the other emissions. INCINERATION IN ERMANY THROUGHPUT YEAR W = 0 W = 25% W = 0 W = 25% Emission Total Emission (1) Mg/yearTotal Emission cor (3) Mg/yearTotal Emission (2) Mg CO/yearTotal Emission cor (4) Mg CO/year 5.81 - 0.2275 10 5.81 10 - 0.2275 10 NOx 0.0154 0.009625 10 0.123 10 0.077 10 O 0.000154 0.000126 10 0.0477 10 - 0.039 10 CO 0.00385 10 0.0018 10 0.0115 10 0.0054 TOC 0.000385 10 0.00027125 10 0.0042 0.0029 10 0.000308 0.00024675 10 not defined Not defined 0 0.000113 10 0 - 0.00237 10 Amount of total emission as CO equivalent from MSW Incineration 5.99 10 Mg COper year -0.18 10 Mg COper year An energy transformation efficiency equal to or greater than about 25 percent results in an allowable average substituted net energy potential that renders the emission of waste incineration plants (calculated as COequivalents) climate-neutral due to the emission credits from the power plant mix.