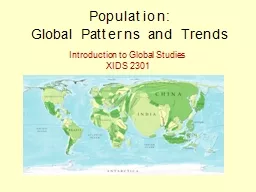
PPT-Gridded Population of the World Version 4

Author : karlyn-bohler | Published Date : 2017-04-29

Basic Demographic Characteristics and Data Quality Metrics SciDataCon September 2016 Greg Yetman Kytt MacManus 2 Socioeconomic Data amp Applications Center SEDAC

Presentation Embed Code

Download Presentation

Download Presentation The PPT/PDF document "Gridded Population of the World Version ..." is the property of its rightful owner. Permission is granted to download and print the materials on this website for personal, non-commercial use only, and to display it on your personal computer provided you do not modify the materials and that you retain all copyright notices contained in the materials. By downloading content from our website, you accept the terms of this agreement.

Gridded Population of the World Version 4: Transcript


Basic Demographic Characteristics and Data Quality Metrics SciDataCon September 2016 Greg Yetman Kytt MacManus 2 Socioeconomic Data amp Applications Center SEDAC Focus on human dimensions of environmental change. 03 Population over 60 2012 919 Life expectancy at birth 2012 Total Male Female 79 Both sexes 76 Male 83 Female Neonatal mortality rate per 1000 live births 2012 11 717 Both sexes Under5 mortality rate per 1000 live births 2012 18 1324 Both sexes Mat HOMEWORK: Complete Peacock model (Doc#19). Evolution . Test June 10,11,15,16. OBJECTIVE:. . I will be able to. . apply a general model of natural selection. to a variety of cases that focus on both survival and reproduction using the specific examples discussed in class earlier in the unit.. Global Patterns and Trends. Introduction to Global Studies. XIDS 2301. Farmers protest. Food riots. http://www.nytimes.com/2008/04/18/world/americas/18food.html. The light blue line shows that between 2005 and 2007, food prices have increased by more than . Verification . Method using ArcGIS: Zone-Based Verification & Bias Maps. Joe Villani. Ian Lee. Vasil Koleci. NWS Albany, NY. Motivation. Utilize Geographic Information Systems (GIS) technology for a gridded and more representative snowfall verification method. • How many people live on the . earth.. • Where do they . live.. • Why do they . move.. • What does the future look . like.. World Population:. 7,045,230,000. +. Where do. most people . live?. As told by Dr. F. Elwell. World Population. In the six seconds it takes you to read this sentence, 24 people will be added to the earth's population.. Within an hour, 11,000 will be added.. By day's end...260,000.. European Forum for . Geostatistics. Krakow – October 2014. Ian . Coady. Geography Policy and Research Manager. Office for National Statistics. Why are we different?. No use of grids at the national or sub-national . Joint Project between. NASA . SPoRT. , NOAA, CIMSS, CIRA, GINA, and STC. Introduction. This training module will take you through the steps on how to use the Gridded NUCAPS to increase situational awareness when diagnosing the pre-convective environment.. Size. Increased by. Decreased by. . Calculations. r = (b – d) (i – e) . Local Population Changes. Global Population Changes. Density. What is it?. . Does the predator or the prey control it?. World Population. In the six seconds it takes you to read this sentence, 24 people will be added to the earth's population.. Within an hour, 11,000 will be added.. By day's end...260,000.. 1 Million every 4 days. Sergio DellaPergolaThe Avraham Harman Institute of Contemporary JewsThe Hebrew University of JerusalemJerusalemIsraelsergioahujiacilSrgio 5llatrgola orld Wwish topulation 2019 in Arnold 5ashfsky and L Data Sheet. PRB’s World Population Data Sheet . at a Glance. ACTIVITY 1. Learning Objectives. Select a country’s population characteristics using PRB’s World Population Data Sheet.. Identify countries that rank highest/lowest in a population indicator.. Data Sheet. PRB’s World Population Data Sheet . at a Glance. ACTIVITY 1. Learning Objectives. Select a country’s population characteristics using PRB’s World Population Data Sheet.. Identify countries that rank highest/lowest in a population indicator.. SW: discuss with their groups how estimating a population could be used in a real world situation.. Population Ecology. Measuring a population. Growth Curves. Biotic Potential vs. Environmental. Resistance.

Download Document

Here is the link to download the presentation.
"Gridded Population of the World Version 4"The content belongs to its owner. You may download and print it for personal use, without modification, and keep all copyright notices. By downloading, you agree to these terms.

Related Documents