/
On Foaming the  Court House Steps: On Foaming the  Court House Steps:

On Foaming the Court House Steps: - PowerPoint Presentation

karlyn-bohler
karlyn-bohler . @karlyn-bohler
Follow
368 views
Uploaded On 2018-02-10

On Foaming the Court House Steps: - PPT Presentation

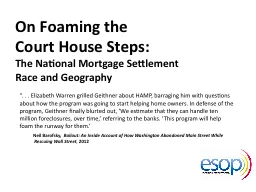
The National Mortgage Settlement Race and Geography Elizabeth Warren grilled Geithner about HAMP barraging him with questions about how the program was going to start helping home owners In defense of the program Geithner finally blurted out We estimate that they can handle ten mi ID: 629982

relief state homeowners nms state relief nms homeowners consumer number total borrowers forgery mortgage 2013 national percentage legally risk current share recipients

Share:

Link:

Embed:

Download Presentation from below link

Download Presentation The PPT/PDF document "On Foaming the Court House Steps:" is the property of its rightful owner. Permission is granted to download and print the materials on this web site for personal, non-commercial use only, and to display it on your personal computer provided you do not modify the materials and that you retain all copyright notices contained in the materials. By downloading content from our website, you accept the terms of this agreement.


Presentation Transcript

Slide1

On Foaming the Court House Steps:The National Mortgage SettlementRace and Geography

“. . . Elizabeth Warren grilled Geithner about HAMP, barraging him with questions about how the program was going to start helping home owners. In defense of the program, Geithner finally blurted out, ‘We estimate that they can handle ten million foreclosures, over time,’ referring to the banks. ‘This program will help foam the runway for them.’ Neil Barofsky, Bailout: An Inside Account of How Washington Abandoned Main Street While Rescuing Wall Street, 2012 Slide2

This graphic captures why the (mal)Distribution of the NMS Consumer Relief can’t be helpfully measured by dollar totals. Costal home values distort the allocations. The only fair measure is the number of borrowers who obtained relief in each state. Slide3

State

Total "Non-Current" Home Owners

Percentage Share of National total of "Non-Current"

607,015 Total Borrower Recipients March 2013 Allocated NMS Consumer Relief

Percentage Share of the National Total of NMS Consumer Relief

Percentage calculation of the Disparities of Consumer ReliefConsumer Relief Disparities by HO Count StateConsumer Relief DisparitiesAK4,5030.1%1740.0%-0.1%-453 CA121,951AL67,7711.6%2,5350.4%-1.1%-6,896 FL28,974AR35,6470.8%1,0000.2%-0.7%-3,961 AZ14,950AZ68,5201.6%24,4854.0%2.5%14,950 NV9,970CA396,7639.1%177,16429.3%20.1%121,951 MI8,068CO50,3611.2%7,0701.2%0.0%62 WA1,406CT65,0261.5%5,9201.0%-0.5%-3,129 ID219DC8,8860.2%8870.1%-0.1%-350 VA147DE19,1960.4%1,2020.2%-0.2%-1,469 MN142FL596,00513.7%111,91318.5%4.8%28,974 OR132GA174,2364.0%20,5993.4%-0.6%-3,647 CO62HI20,8310.5%1,5970.3%-0.2%-1,302 UT-30IA25,7000.6%1,0710.2%-0.4%-2,505 ND-189

Sample of the Derived State TableSlide4

“At-Risk” homeowners uses the April 2013, LPS

Mortgage Monitor

report of delinquency and pending foreclosure rates, broken out by state.

That percentage was then multiplied by the “corrected” state-level, pending mortgage tally included in the Mortgage Bankers’ 3Q12 National Delinquency Survey.

The resulting number is a rough take on how many homeowners in each state are “seriously delinquent” or in the parlance of LPS, “non-current.”

To arrive at the percentages in the chart above, I took the total number of borrowers who obtained Consumer Relief, by state, in the most recent NMS Monitor’s Report (March 2013) and divided it by each state’s total of At-Risk borrowers.Slide5

This graph converts the calculations from the previous slide into a number of homeowners who did, and did not, obtain relief under the NMS. “0” on the vertical axis would mean that the number of borrower recipients under the NMS, as of March of 2013, correlates to the number of at-risk borrowers in each state, assuming that the NMS were distributed to each state in proportion to it’s share of at-risk homeowners nationally.

By this estimate, while Ohio borrowers totaled

9,593

if there was parity there would be an additional

12,379

consumer relief recipients.Slide6
Slide7
Slide8

4Q12 Zillow-Trans Union Negative Equity Zip Code BreakoutsSlide9

Criminal offenses against public justice of staggering and unknown proportionsTo get back to the conduct that created the liability supporting the final NMS Consent Decree, servicers, trustees, lawyers, default services providers, and the banks that housed and/or funded the foregoing parties, orchestrated an historically unprecedented wave of crimes against public justice in the state and federal courts, in order to mislead judges, magistrates, trustees, land records clerks, homeowners and

the public. These crimes included:Conspiracy to commit forgery and forgery of lost notes and mortgage assignments in the form of legally baseless wholly “reconstructed” documents.Conspiracy to commit forgery and forgery of note “allonges” intended to mislead homeowners and the courts into believing that the foreclosing entity was legally entitled to pursue a forfeiture.Slide10

There were uncountable instances of:Suborning perjury and perjury by written, sworn and notarized affidavits asserting facts unknown to the corporate

affiant intended to persuade a court to order a legally baseless forfeiture and sale of a mortgaged home.Conspiracy to commit misrepresentation and impersonation, and misrepresentation and impersonation and signature forgery by the foreclosing parties (and their vendors) asserting an elevated legal status and authority within the involved

lender-corporation(s). These fictitious “Linda Green” events happened hundreds of thousands of times while servicers and their vendors prosecuted foreclosures across the country. Slide11
Slide12
Slide13