PPT-Draw a Frequency Table for this pictogram
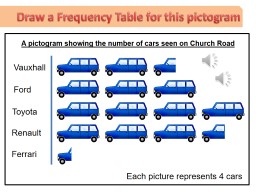
Ferrari Renault Toyota Ford Vauxhall A pictogram showing the number of cars seen on Church Road Each picture represents 4 cars Pictograms Learning Objectives Able
Download Presentation
"Draw a Frequency Table for this pictogram" is the property of its rightful owner. Permission is granted to download and print materials on this website for personal, non-commercial use only, provided you retain all copyright notices. By downloading content from our website, you accept the terms of this agreement.
Presentation Transcript
Transcript not available.