/
Major Climate Zones Major Climate Zones

Major Climate Zones - PowerPoint Presentation

kittie-lecroy
kittie-lecroy . @kittie-lecroy
Follow
447 views
Uploaded On 2017-12-24

Major Climate Zones - PPT Presentation

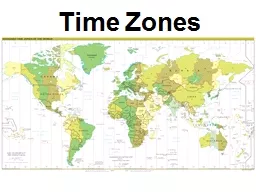
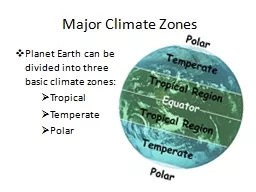
Planet Earth can be divided into three basic climate zones Tropical Temperate Polar Major Climate Zones Tropical Climates Occur near the equator and the lower latitudes Includes Rainforests that are warm ID: 617667

zones climate major year climate zones year major climates equator graph hot poles warm climograph polar temperate tropical summers cool cold climatesoccur

Share:

Link:

Embed:

Download Presentation from below link

Download Presentation The PPT/PDF document "Major Climate Zones" is the property of its rightful owner. Permission is granted to download and print the materials on this web site for personal, non-commercial use only, and to display it on your personal computer provided you do not modify the materials and that you retain all copyright notices contained in the materials. By downloading content from our website, you accept the terms of this agreement.


Presentation Transcript

Slide1

Major Climate Zones

Planet Earth can be divided into three basic climate zones:

Tropical

Temperate

PolarSlide2

Major Climate Zones

Tropical Climates

Occur near the equator and the lower latitudes

Includes:

Rainforests that are warm, muggy, and rainy year-round.Deserts that are hot and dry year-round. Slide3

Major Climates Zones

Temperate Climates

“Temperate” means moderate or mild.

Occur about halfway between the equator and the poles in the middle latitudes.

These climates tend to have all four seasons with warm or hot summers and cool to cold winters.Slide4

Major Climate Zones

Polar ClimatesOccur near the poles at the higher latitudes

Winters are long and bitterly cold.

Summers are short and cool.

Temperatures are below freezing for more than half the year.Slide5

Climate-Graphs

A quick way to get an idea of the climate of a particular place is to look at a "climate-graph," or "

climograph

." A

climograph is what scientists create to show a particular location's average temperature and precipitation during the year.Click the graph above for an Interactive Climate Map.