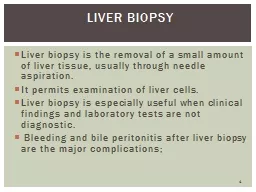
/
Evaluation of  liver   steatosis Evaluation of  liver   steatosis

Evaluation of liver steatosis - PowerPoint Presentation

kylie
kylie . @kylie
Follow
67 views
Uploaded On 2023-07-17

Evaluation of liver steatosis - PPT Presentation

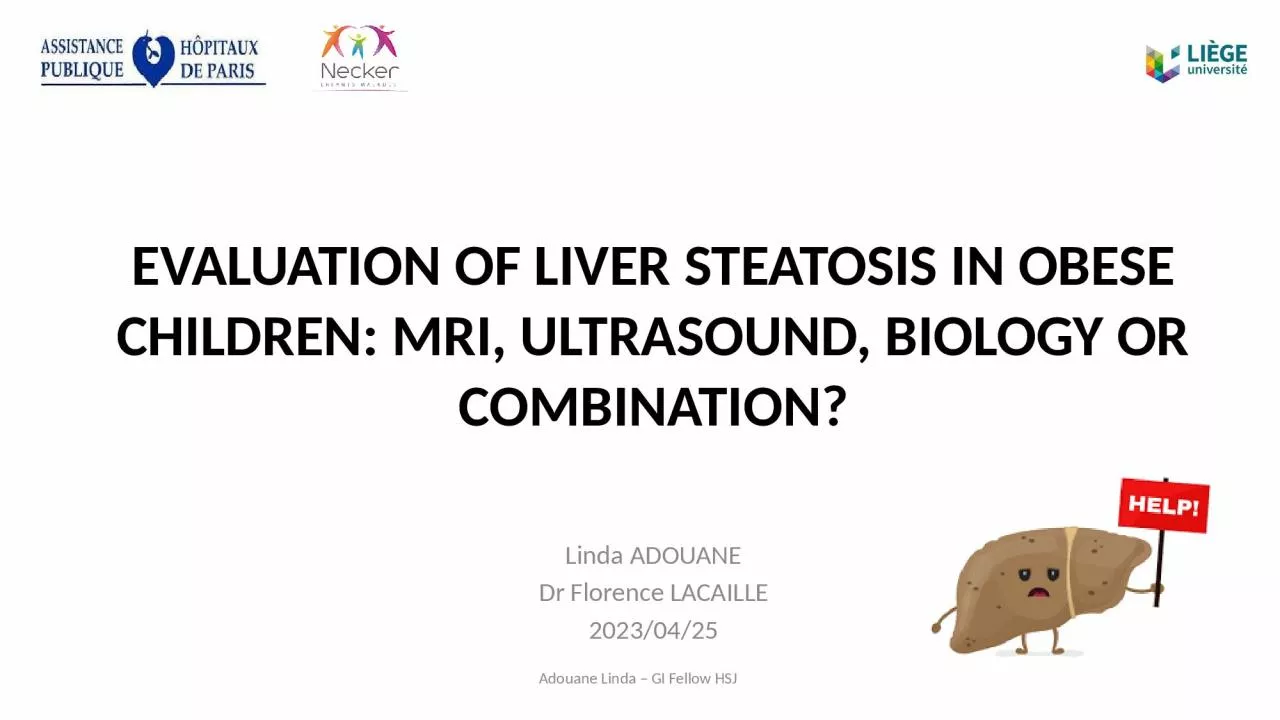
in obese children MRI ultrasound biology or combination Linda ADOUANE Dr Florence LACAILLE 20230425 Adouane Linda GI Fellow HSJ No funding No conflicts of interest ID: 1009232

iqr median liver steatosis median iqr steatosis liver alt pdff nafld index enfant paris ate validation bmi necker pital

Share:

Link:

Embed:

Download Presentation from below link

Download Presentation The PPT/PDF document "Evaluation of liver steatosis" is the property of its rightful owner. Permission is granted to download and print the materials on this web site for personal, non-commercial use only, and to display it on your personal computer provided you do not modify the materials and that you retain all copyright notices contained in the materials. By downloading content from our website, you accept the terms of this agreement.


Presentation Transcript

1. Evaluation of liver steatosis in obese children: MRI, ultrasound, biology or combination?Linda ADOUANEDr Florence LACAILLE2023/04/25Adouane Linda – GI Fellow HSJ

2. No funding.No conflicts of interest.AUTHOR’S STATEMENTS

3. Gold standardValidated and standardized technique First-line method BUT never been validated or standardized BACKGROUND

4. B. G. P. Koot and V. Nobili « Screening for non-alcoholic fatty liver disease in children: do guidelines provide enough guidance? ». Obesity Reviews, 2017

5. AIM- Developing NAFLD noninvasive biomarker correlated to PDFF.- Validation of NAFLD existing scores.- Establishing a new score that could be used to predict NAFLD. VERSUSPrimary endpoint Secondary endpoints

6. PATIENTS AND METHODInclusion criteriaAge: 0 - 18 yearsBody mass index (BMI) > IOTF 30Exclusion criteriaContraindications to MRISyndromic disorders, liver disease other than NAFLD, metabolic diseaseFull set of tests not entirely conducted

7. Proton density fat fraction (PDFF): > 5%.Attenuation coefficient (ATT): 0.55 dB/cm/MHz.Speed of sound (SOS): ≃  1.528 mm/μsec in fatty liver.Appraisal of steatosis

8. Fast ≥ 6 hoursBlood sample All exams performed the same day Study design*(ALOKA ARIETTA 850; Hitachi Ltd, Tokyo, Japan)*

9. RESULTSPatients with BMI > IOTF 30 (n=118)Eligible patients (n=99) evaluated as followsLaboratory dataLiver steatosis (ATT, SOS, PDFF)Liver elastography (MRE, SWE)PDFF < 5% (n=55)PDFF > 5 %(n=44)Excluded (n=19)Patients with syndromic disordersFailure of MRIFailure to undergo all tests

10. 44%66%77%

11. Performance of US VS MRIATTSOS=> No correlation between US VS MRI.

12. Performance of biological parametersParameterAUCLowerUpperALT0.880.810.95AST0.80.710.89GGT0.660.550.77TG0.720.610.82HDL0.630.520.74HOMA0.670.560.77AST: Aspartate-aminotransferase; ALT: Alanine-aminotransferase; GGT: Gamma-glutamyl transferase; TG: Triglyceride; HDL-C: High density lipoprotein – Cholesterol; HOMA: Homeostasis model of assessment of insulin resistance. => ALT is the best plasmatic biomarker to predict NAFLD, followed by AST and TG.

13. Validation of previous published scoresAST/ALT Ratio (AAR)AAR: AST (U/l)/ALT (U/l)Reverse correlation: Lower values predict steatosis

14. Validation of previous published scoresTriglyceride-Glucose Index (TyG)TyG: Log [(fasting triglycerides (mg/dL) x fasting glucose (mg/dL)/2]

15. Validation of previous published scoresHepatic Steatosis Index (HSI)HSI: 8 * ALT/AST + BMI (+2, if type 2 diabetes; +2, if female)

16. Conception of the ATE indexATE index = [ALT (U/l) + TG (mmol/l) + E (kPa)] AUC 0.89 {0.81-0.96}

17. p < 0.000133.6=> ATE index is a good predictive score of steatosis with a cutoff of 33.6.

18. DISCUSSIONNo underlying liver diseaseReference center for obesityObjective, diagnostic parametersFirst known French study on the subjectBiomarker proposed: ATE indexBias of selectionMissing dataOnly one ultrasound system used Lack of histology

19. Obesity = risk factor for NAFLD (44% in our cohort)MRI = validated, standardized noninvasive tool Ultrasound = not reliable (ALOKA ARIETTA 850; Hitachi Ltd, Tokyo, Japan)Biological + imaging = AlwaysExternal validation of steatosis scores needed, including ATE indexTAKE-HOME MESSAGE

20. Linda ADOUANE 1,2, Claire MAYER 1, Yanyan LIN 3,4, Anne-Marie TISSIER 5, Jean-Michel CORREAS 5, Ivan LERN 6, Myriam DABBAS 1,7, Florence LACAILLE 1.  1. Service de Gastroentérologie, Hépatologie et Nutrition pédiatrique, Hôpital Universitaire Necker Enfant Malade, AP-HP et Centre National de Reference des Maladies rares, Paris, France2. Université de Liège, Belgium3. Department of Ultrasound, RuiJin Hospital, Shangai Jiaotong University, Shangai, China4. Sorbonne Université, CNRS, INSERM, Laboratoire d’Imagerie Biomédicale, Paris, France5. Service d’Imagerie médicale, Hôpital Universitaire Necker Enfant Malade, AP-HP, Paris, France6. Informatique biomédicale, Hôpital Universitaire Necker Enfant Malade, AP-HP, Paris, France7. Unité de Nutrition-Obésité, Hôpital Necker Enfant Malade, AP-HP et Centre de référence médico-chirurgical pour la prise en charge de l’obésité de l’enfant et l’adolescent, Paris, France.

21. APPENDIX

22. CharacteristicsTotal(n = 99)Healthy liver * (n = 55)Fatty liver **(n = 44)ClinicalAge at diagnosis (years) (median [IQR])BMI (median [IQR]) 11 [10-13]35.7 [32-40] 11 [8.5-12.5]35.3 [32-38] 11 [9-13]36 [33-41]Plasma biomarkersAST (U/l) (median [IQR])ALT (U/L) (median [IQR])GGT (U/l) (median [IQR])HOMA (median [IQR])TG (mmol/l) (median [IQR])HDL-C (mmol/l) (median [IQR])27 [23-35]24 [17-38]19 [16-25]3.5 [2.5-5.5]0.9 [0.72-1.19]1.1 [1-1.3]25 [22-27]19 [14-24]18 [15-23]3 [2-5]0.8 [0.6-1.0]1.2 [1.1-1.3]32 [28-41]37 [28-54]21 [17-32]4 [3-6.5]1.1 [0.9-1.2]1.1 [0.9-1.2]Steatosis scoresAAR (U/L) (median [IQR])TyG (mg/l) (median [IQR])HIS (median [IQR])ATE index (median [IQR])  1.1 [0.9-1.4]5.8 [5.6-6.1]45 [40-50]31 [23.8-44.5]  1.3 [1.1-1.6]5.7 [5.5-6.0]43 [39-46]24,8 [21.3-29]  0.9 [0.6-1.1]6.1 [5.8-6.2]48 [43.5.-53.1]44.7 [35.2.-57.9]ImagingATTSOSEMRE0.6 [0.5-0.7]1.3 [1.2-1.5]5.4 [4.4-6.5]6.3 [6.0-7.3]0.6 [0.5-0.7]1.3 [1.2-1.5]5.0 [4.3-6.2]6.3 [5.9-7.3]0.6 [0.5-0.7]1.3 [1.2-1.5]5.7 [4.7-7.1]6.4 [6.0-7.3]Imaging definition using PDFF: * <5%; ** >5%.