/
LCFS Indirect Land Use Change Expert Workgroup LCFS Indirect Land Use Change Expert Workgroup

LCFS Indirect Land Use Change Expert Workgroup - PowerPoint Presentation

liane-varnes
liane-varnes . @liane-varnes
Follow
343 views
Uploaded On 2020-01-06

LCFS Indirect Land Use Change Expert Workgroup - PPT Presentation

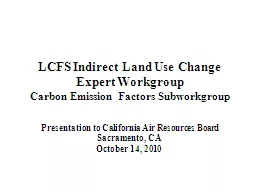
LCFS Indirect Land Use Change Expert Workgroup Carbon Emission Factors Subworkgroup Presentation to California Air Resources Board Sacramento CA October 14 2010 Objective Provide a summary of our preliminary considerations of most recent GTAP analysis Tyner et al 2010 and the appropriateness o ID: 772103

factors emission iluc emissions emission factors emissions iluc carb ewg biomass data analysis forest peatland soil land gtap hwp

Share:

Link:

Embed:

Download Presentation from below link

Download Presentation The PPT/PDF document "LCFS Indirect Land Use Change Expert Wor..." is the property of its rightful owner. Permission is granted to download and print the materials on this web site for personal, non-commercial use only, and to display it on your personal computer provided you do not modify the materials and that you retain all copyright notices contained in the materials. By downloading content from our website, you accept the terms of this agreement.


Presentation Transcript

LCFS Indirect Land Use Change Expert WorkgroupCarbon Emission Factors Subworkgroup Presentation to California Air Resources Board Sacramento, CA October 14, 2010

Objective Provide a summary of our preliminary considerations of most recent GTAP analysis (Tyner et al. 2010) and the appropriateness of the assumption/changes Biomass and soil carbon stock Biomass and soil carbon EFassumption of 25 percent of forest biomass is indefinitely sequestered in wood products 2 CARB ILUC EWG Emission Factors

Our Preliminary Considerations and Suggestions #1. Evaluate the spatially-explicit Winrock database as a basis for estimating biomass C stock by AEZ #2. Supplement with databases to improve the accuracy of certain regions/eco-system types (such as peatlands), or to include the consideration of certain factors (e.g. forest degradation and fire) #3. Provide clear justification for the consideration of C stored in harvested wood product (HWP) 3 CARB ILUC EWG Emission Factors

Our Preliminary Considerations and Suggestions -Cont’d #4. Provide clear justification for the consideration of other non-land conversion emissions Livestock emissions Rice production emissionsCrop switching Differences in on-farm energy and agrichemical use#5. Conduct sensitivity analysis on the effects of non-Kyoto climate forcing gases and particles #6. Perform uncertainty analysis, including uncertainty propagation and uncertainty importance analysis CARB ILUC EWG Emission Factors 4

#1. GTAP, Woods Hole and Winrock Regions 5 CARB ILUC EWG Emission Factors GTAP Winrock* WHRC Winrock* United States 49 United States 49 Canada 13 Canada 13 Sub Saharan Africa 85 Africa85EU 2726Europe43E Europe and Rest of Former Soviet Union10Rest of European Countries10Russia88Former Soviet Union93Brazil29Latin America124Central and Caribbean Americas39S & Other Americas56Mid East & N Africa45N Africa45E Asia4Pac Developed15Oceania10Japan1China & Hong Kong31China/India/Pakistan67India35Rest of SE Asia172S & SE Asia222Rest of S Asia6Malaysia & Indonesia45 * Winrock data is divided into countries and for some a further breakdown by administrative unit. The quantity given is the number of regions for each given GTAP region (Note: Some values are different because the regions are not exactly the same)

GTAP 18 Regions + AEZs Map by Sahoko Yui, UC-Davis Use GIS data to estimate C stocks for GTAP region / AEZs CARB ILUC EWG Emission Factors 6

Uses a range of geographically explicit data of varying quality Some based on field data + GIS modeling Others based on radar Relies on best availableWinrock Biomass Database 7

Compiled by OSU, funded by EPA Climate Analysis BranchData for all GTAP Regions, by AEZ, & Accessible vs. Inaccessible Land; Mix of different Inventory Source Data (FAO, USDA, others) Partially Reviewed Model and Methodology Example: Alternative Approach to Forest Biomass 8

Accessible vs. Inaccessible Forest Area Methodology dependent on region For Europe: All Forest Area Deemed Accessible For USA: Accessibility is a function of timber demand / timber price For Tropics (China, Russia): Accessibility is based on proximity of forestland to roadways

Alternative Approach to Forest Biomass Need to ultimately create data set by AEZ & by Accessibility Can adopt OSU data since it is available or create new data set and compare to OSU   Sohngen Accessible (tC/ha) Sohngen Inaccessible (tC/ha) Woods Hole (tC/ha) US 48 96 113 Brazil102103102Canada303074India2970139Russia174665Japan4610875

Harmonized World Soil Database (HWSD) 0-100 cm soil C concentration can be calculated. Last updated March 2009 though lots of missing data especially for subsoil (30-100 cm), see following slides. 11 Map by Sahoko Yui, UC-Davis (t C/ha)

HWSD by AEZ CARB ILUC EWG Emission Factors 12 Map by Sahoko Yui, UC-Davis (t C/ha)

HWSD Missing information topsoil (0-30 cm) subsoil (30-100 cm) CARB ILUC EWG Emission Factors 13

Forest EF CARB GTAP 2010 EPA RFS2 National Inventory Reports t CO 2 /ha (includes biomass and soil) US 773 587 385 418 Canada 710 458 251 295EU109557299220-366

Pasture EF CARB GTAP 2010 EPA RFS2 National Inventory Reports t CO 2 /ha (includes biomass and soil) US 110 110 41 58 Canada 199 171 59 39EU1301997773

Biomass & Soil C Recommendations Use best available spatially-explicit, published datasets to provide estimates by GTAP regions and AEZ combinations Rely on largely datasets underlying Winrock biomass analysis with improved data in a few locations Use GIS to estimate soil C for region / AEZ using global datasets; STATSGO for U.S. Use satellite-based land cover maps to pull out carbon estimates for grassland, forest, cropland etc Supplement with literature values for peatlands CARB ILUC EWG Emission Factors 16

#2. Include Peatland Emissions Peatland stores large amount of carbon stock and is a large sink for atmospheric carbon Tropical peatland is ~11% of global peatland area and 15% of global peat carbon pool 75% is in Southeast Asia (65% in Indonesia and 10% in Malaysia). CARB ILUC EWG Emission Factors CARB ILUC EWG Emission Factors 17

Tropical Peatland Emission Factors Winrock Peatlands cover 2-44% and 2-22% in some of the corresponding administrative regions in Indonesia and Malaysia, respectively. Assume cumulative emissions of 600 or 1600 t C/ha for 30 or 80 yrs, respectively (EF = 20t C/ha/yr assuming 80 cm drainage depth) Fargione et al. (2008) assumes 941 t C/ha (EF = 18.8 t C/ha/yr for 50 yrs) Both studies noted that these assumptions lack rigor, especially the duration of emissions CARB ILUC EWG Emission Factors 18

Peatland Drainage and Carbon Emissions Schematic illustration of progressive subsidence of the peat surface in drained peatland, due to peat decomposition resulting in CO 2 emission, as well as compaction. CARB ILUC EWG Emission Factors 19 Source: Hooijer et al. (2010): CO2 emissions from drained peat in Southeast Asia

EF Based on Land Conversion Types Unit CO 2 emission is a linear function of groundwater depth and % area drained in converted landGreater drainage is needed for large cropland/palm plantationCropland/palm plantation keeps average water tables always below 0.7 m, but they are often as deep as 1.2m on average CARB ILUC EWG Emission Factors 20 Source: Hooijer et al. (2010): CO2 emissions from drained peat in Southeast Asia

Peatland EF Recommendations Use best available spatially-explicit, published literature data to provide estimates Emission factor should be weighted by peatland (conversion) area by GTAP regions and AEZ combinations, such information should come from Land Conversion Type subgroup To the extend possible, use EF by land use conversion type such as the table shown in the previous slide. Source: Hooijer et al. (2010): CO2 emissions from drained peat in Southeast Asia 21

Peatland Emissions from Fossil Fuel Land Use Though not directly related to biofuel land use, the topic may be relevant to Other Indirect Emissions subgroup. Boreal peatlands store 85% of global peat, contain ~ 6 times more carbon than tropical peatlands LU GHG emissions (t CO2e/ha) from oil sands surface mining development can be comparable or higher than biofuels, primarily due to peatland disturbance and CH 4 emissions from tailings pond (see next slide) CARB ILUC EWG Emission Factors 22 Source: Yeh et al. (2010)

Peatland Emissions from Fossil Fuel Land Use Fossil fuel LU EF (t C/ha) is significantly lower than for biofuels due to higher fossil fuel yield. CARB ILUC EWG Emission Factors 23 Source: Yeh, Jordaan, Brandt et al. (2010) ES&T, in press

When wood is taken out of forest systems, C is either stored in product-in-use and landfill; or emitted, combusted, or decomposed and recycle back to the atmosphere. Fraction of C stored in HWP depends on How much (and what type of wood) is removed from the forest system; Types of end-use products; and Lifetime of C remains in end-use products and landfills CARB ILUC EWG Emission Factors 24 #3. Long-term C Storage in Harvested Wood Products (HWPs)

CARB ILUC EWG Emission Factors 25 Fraction of C Remaining in End Use by Enduse Category, US Source: U.S. Department of Energy, 2006. Guidelines for Voluntary Greenhouse Gas Reporting. Source: Mueller et al (2010) manuscript

#3. Long-term C Storage in HWP in the US In the US, on average 23 percent of the aboveground biomass removed from forest stands has been sequestered after 30 years (Mueller et al.)(see previous slide)In the US and Canada, only roughly 50% of harvested biomass is removed from forest system Need adjustment to account for belowground biomass and the fraction left on the ground (eventually decompose and is incorporated into soil or released as CO2)This calculation does not take into account fossil emissions displaced by wood product for energy production and by displacing energy intensive materials such as concrete and steel. The C storage factor may be even smaller for developing countries due to lower removal and mill efficiency, faster decomposition, etc. CARB ILUC EWG Emission Factors 26

HWP EF Recommendations Based on our examination, there is sufficient data to consider C storage HWP in the US and other developed countries. However, data of global HWP disposition by country and long-term carbon storage factor by wood-type and end-product (preferably by region) is difficult to obtain. Short-term: include sensitivity analysis of C storage in HWP (30 yrs, 50 yrs, 100 yrs) Long-term: global calculation of HWP and include uncertainty in HWP dispositionPotential consideration of energy displacement, construction material displacement, and price effects (demand reduction). CARB ILUC EWG Emission Factors 27

#4. Summary of Emission Factors of Other Indirect Effects There are other indirect impacts beyond changes in carbon stocks (biomass + Soil C). Livestock emissions Rice production emissionsCrop switching and changes in energy and chem. use The changes can be positive or negative. For some pathways the other emissions are significant (~25% of ILUC for soybean biodiesel). See August subgroup presentation for details 28 CARB ILUC EWG Emission Factors

Yields (bushels/acre) of two primary crops (corn and soybeans) grown in the U.S. have increased dramatically over the past approximately 30 years for the same amount of fertilizer applied Further studies are needed to determine whether the observed decrease in fertilizer use should be applied to reference case, or ILUC scenarios (e.g. increase yield with no changes in fertilizer use?) Fertilizer Use and N 2 O Emissions 29 Source: Nelson et al.

Other Indirect EF Recommendations This whole issue of fertilizer vs. yield needs to be thought through as to how much is covered in the direct emission calculation and what the incremental emissions/unit of production might be for the indirect emissions. N 2O emissions and N2 application rate have significant implications for GHG emissions. Better regional data would be useful in considering fertilizer use and N2 O emissions in the reference case and ILUC scenarios. CARB ILUC EWG Emission Factors 30

#5. Non-Kyoto Climate Forcing Gases and Particles Emission g/kg DM a GWP 100 g CO 2 e/kg EF contrib. CO 2 1640 1 b 1640 70% CO653 c1958%CH42.425 b603%NMHC3.18 c251%NOX3.1-1 c-30%N2O0.15298 b452% BC 0.8 680 d 544 23% OC 3.2 -50 e -160 -7% Total EF 2345 100% a Delmas et al. 1995; b IPCC AR4; c Brakkee et al 2008; d Bond and Sun 2005; e Sanhueza 2009 Source: Courtesy of Richard Plevin 31

32 Savanna Burning Emission Factor 32

Non-Kyoto Climate Forcing Gases and Particles Recommendations Non-Kyoto climate forcing gases and particles can contribute to large uncertainties and significantly increase the estimated impacts of biofuel LUC emissions. The use of these Non-Kyoto gases would also require that the gasoline and diesel reference fuels would need to be re-done. Sensitivity analysis (short-term) and uncertainty analysis (long-term) should be performed to explicitly consider the effects of non-Kyoto climate forcing gases and particles CARB ILUC EWG Emission Factors 33

Recommendations on Treatment of Uncertainty Short-term : Incorporate range of uncertainties reported in the datasets/literature for biomass and soil C. Use sensitivity analysis or scenario analysis to illustrate the importance of the consideration of certain parameters , such as HWP, other non-land conversion emissions, non-Kyoto climate forcing gases and particles. Use parametric analysis to estimate effect of specific time profile to examine emissions over time or scenario analysis to consider different approaches to handling time, (e.g., simple amortization, cumulative radiative forcing, discounting). Long-term: Include probability distributions for all estimates. Propagate uncertainty using Monte Carlo simulation. Use global SA to estimate uncertainty importance to identify which parameters drive overall variance. CARB ILUC EWG Emission Factors 34

Remaining Important Issues This subgroup has not had a chance to provide a comprehensive review of the following issues: EF related to changes in biomass C stock Fire emissionsForest categories (disturbed vs undisturbed, maturity, degradation, drought)EF of soil C emissions after LU conversion Dynamic modeling of LU emission changes (stock + flow) vs. categorical modeling (percent changes in stock)Albedo effect Some of these issues may be included in the final report. However, CARB should conduct independent studies to determine the effect of these issues (long-term). CARB ILUC EWG Emission Factors 35