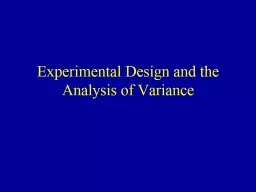
/
Experimental Design and the Analysis of Variance Experimental Design and the Analysis of Variance

Experimental Design and the Analysis of Variance - PowerPoint Presentation

lindy-dunigan
lindy-dunigan . @lindy-dunigan
Follow
429 views
Uploaded On 2017-10-27

Experimental Design and the Analysis of Variance - PPT Presentation

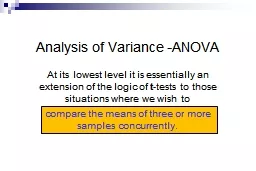
Comparing t gt 2 Groups Numeric Responses Extension of Methods used to Compare 2 Groups Independent Samples and Paired Data Designs Normal and nonnormal data distributions Completely Randomized Design CRD ID: 600069

effects factor levels random factor effects random levels error interaction test means method model block treatment table group sample

Share:

Link:

Embed:

Download Presentation from below link

Download Presentation The PPT/PDF document "Experimental Design and the Analysis of ..." is the property of its rightful owner. Permission is granted to download and print the materials on this web site for personal, non-commercial use only, and to display it on your personal computer provided you do not modify the materials and that you retain all copyright notices contained in the materials. By downloading content from our website, you accept the terms of this agreement.


Presentation Transcript

Slide1

Experimental Design and the Analysis of VarianceSlide2

Comparing

t > 2 Groups - Numeric Responses

Extension of Methods used to Compare 2 GroupsIndependent Samples and Paired Data DesignsNormal and non-normal data distributionsSlide3

Completely Randomized Design (CRD)

Controlled Experiments - Subjects assigned at random to one of the

t treatments to be comparedObservational Studies - Subjects are sampled from t

existing groupsStatistical model yij is measurement from the jth subject from group

i:

where

m

is the overall mean,

a

i

is the effect of treatment

i

,

e

ij

is a random error, and

m

i

is the population mean for group

iSlide4

1-Way ANOVA for Normal Data (CRD)

For each group obtain the mean, standard deviation, and sample size:

Obtain the overall mean and sample sizeSlide5

Analysis of Variance - Sums of Squares

Total Variation

Between Group (Sample) Variation

Within Group (Sample) VariationSlide6

Analysis of Variance Table and

F-Test

Assumption: All distributions normal with common variance

H

0

: No differences among Group Means (

a

1

=

 =

a

t

=0)

H

A

: Group means are not all equal (Not all

a

i

are 0)Slide7

Expected Mean Squares

Model:

yij = m

+ai + e

ij with eij ~ N(0,s2), Sa

i

= 0:Slide8

Expected Mean Squares

3 Factors effect magnitude of

F-statistic (for fixed t)True group effects (

a1,…,at)

Group sample sizes (n1,…,nt)Within group variance (s2)Fobs =

MST

/

MSE

When

H0 is true (a1

=…=

a

t

=0),

E

(MST)/E(MSE)=1 Marginal Effects of each factor (all other factors fixed)

As spread in (a1,…,at

)

E

(

MST

)/

E(MSE) As (n1

,…,nt)  E(MST)/E(MSE)  (when H0

false)As s2

E

(

MST

)/

E

(

MSE

)

 (when

H

0

false)Slide9

A)

m

=100,

t

1

=-20,

t

2

=0,

t

3

=20,

s

= 20

B)

m

=100,

t

1

=-20,

t

2

=0,

t

3

=20,

s

= 5

C)

m

=100,

t

1

=-5,

t

2

=0,

t

3

=5,

s

= 20

D)

m

=100,

t

1

=-5,

t

2

=0, t3=5, s = 5Slide10

Example - Seasonal Diet Patterns in Ravens

“Treatments” -

t = 4 seasons of year (3 “replicates” each)Winter: November, December, JanuarySpring: February, March, April

Summer: May, June, JulyFall: August, September, OctoberResponse (Y) - Vegetation (percent of total pellet weight)Transformation (For approximate normality):

Source: K.A. Engel and L.S. Young (1989). “Spatial and Temporal Patterns in the Diet of Common Ravens in Southwestern Idaho,”

The Condor

, 91:372-378Slide11

Seasonal Diet Patterns in Ravens - Data/MeansSlide12

Seasonal Diet Patterns in Ravens - Data/MeansSlide13

Seasonal Diet Patterns in Ravens - ANOVA

Do not conclude that seasons differ with respect to vegetation intakeSlide14

Seasonal Diet Patterns in Ravens - Spreadsheet

Total SS Between Season SS Within Season SS

(Y’-Overall Mean)

2

(Group Mean-Overall Mean)

2

(Y’-Group Mean)

2

Slide15

CRD with Non-Normal Data

Kruskal-Wallis Test

Extension of Wilcoxon Rank-Sum Test to k > 2 GroupsProcedure:

Rank the observations across groups from smallest (1) to largest ( N = n1+...+n

k ), adjusting for tiesCompute the rank sums for each group: T1,...,Tk . Note that T1+...+Tk =

N

(

N

+1)/2Slide16

Kruskal-Wallis Test

H

0

: The k population distributions are identical (m1=...=mk) H

A

: Not all

k

distributions are identical (Not all

mi

are equal)

An adjustment to

H

is suggested when there are many ties in the data. Formula is given on page 344 of O&L.Slide17

Example - Seasonal Diet Patterns in Ravens

T

1

= 12+8+6 = 26

T

2

= 5+9+10.5 = 24.5

T

3

= 4+3+1 = 8

T

4

= 2+10.5+7 = 19.5Slide18

Transformations for Constant VarianceSlide19

Welch’s Test – Unequal VariancesSlide20

Example – Seasonal Diet Patterns in RavensSlide21

Linear Contrasts

Linear functions of the treatment means (population and sample) such that the coefficients sum to 0.

Used to compare groups or pairs of treatment means, based on research question(s) of interest Slide22

Orthogonal Contrasts & Sums of SquaresSlide23

Simultaneous Tests of Multiple Contrasts

Using

m contrasts for comparisons among t treatmentsEach contrast to be tested at

a significance level, which we label as aI for individual comparison Type I error rateProbability of making at least one false rejection of one of the

m null hypotheses is the experimentwise Type I error rate, which we label as aETests are not independent unless the error (Within Group) degrees are infinite, however Bonferroni inequality implies that aE ≤

m

a

I

 Choose aI =

a

E

/

mSlide24

Scheffe’s

Method for All Contrasts

Can be used for any number of contrasts, even those suggested by data. Conservative (Wide CI’s, Low Power)Slide25

Post-hoc Comparisons of Treatments

If differences in group means are determined from the

F-test, researchers want to compare pairs of groups. Three popular methods include:Fisher’s LSD - Upon rejecting the null hypothesis of no differences in group means, LSD method is equivalent to doing pairwise comparisons among all pairs of groups as in Chapter 6.

Tukey’s Method - Specifically compares all t(t-1)/2 pairs of groups. Utilizes a special table (Table 11, p. 701).Bonferroni’s Method - Adjusts individual comparison error rates so that all conclusions will be correct at desired confidence/significance level. Any number of comparisons can be made. Very general approach can be applied to any inferential problemSlide26

Fisher’s Least Significant Difference Procedure

Protected Version is to only apply method after significant result in overall

F-testFor each pair of groups, compute the least significant difference (LSD)

that the sample means need to differ by to conclude the population means are not equalSlide27

Tukey’s

W Procedure

More conservative than Fisher’s LSD (minimum significant difference and confidence interval width are higher).Derived so that the probability that at least one false difference is detected is

a (experimentwise error rate) Slide28

Bonferroni’s Method (Most General)

Wish to make

C

comparisons of pairs of groups with simultaneous confidence intervals or 2-sided tests When all pair of treatments are to be compared, C = t(t-1)/2 Want the overall confidence level for all intervals to be “correct” to be 95% or the overall type I error rate for all tests to be 0.05

For confidence intervals, construct (1-(0.05/C))100% CIs for the difference in each pair of group means (wider than 95% CIs)

Conduct each test at

a

=0.05/C significance level (rejection region cut-offs more extreme than when

a

=0.05)

Critical

t

-values are given in table on class website, we will use notation:

t

a

/2,C,n

where

C

=#Comparisons,

n

= dfSlide29

Bonferroni’s Method (Most General)Slide30

Example - Seasonal Diet Patterns in Ravens

Note: No differences were found, these calculations are only for demonstration purposesSlide31

Randomized Block Design (RBD)

t

> 2 Treatments (groups) to be comparedb Blocks of homogeneous units are sampled. Blocks can be individual subjects. Blocks are made up of

t subunitsSubunits within a block receive one treatment. When subjects are blocks, receive treatments in random order.Outcome when Treatment i is assigned to Block

j is labeled YijEffect of Trt i is labeled ai Effect of Block j is labeled

b

j

Random error term is labeled

e

ijEfficiency gain from removing block-to-block variability from experimental errorSlide32

Randomized Complete Block Designs

Test for differences among treatment effects:

H

0

:

a

1

= ... =

a

t

=

0 (

m

1

= ... =

m

t

)

H

A: Not all

ai = 0 (Not all mi

are equal)Slide33

RBD - ANOVA

F-Test (Normal Data)

Data Structure: (

t

Treatments,

b

Blocks

)

Mean for Treatment

i

:

Mean for Subject (Block)

j

:

Overall Mean:

Overall sample size:

N

=

bt

ANOVA:

T

reatment, B

lock, and Error Sums of Squares Slide34

RBD - ANOVA

F-Test (Normal Data)

ANOVA Table:

H

0

:

a

1

= ... =

a

t

=

0 (

m

1

= ... =

m

t

)

H

A

: Not all

a

i

= 0 (Not all

m

i

are equal)Slide35

Pairwise Comparison of Treatment Means

Tukey’s Method-

q in Studentized Range Table with n = (

b-1)(t-1)

Bonferroni’s Method -

t

-values from table on class website with

n

= (

b

-1)(

t

-1) and

C

=

t

(

t

-1)/2Slide36

Expected Mean Squares / Relative Efficiency

Expected Mean Squares: As with CRD, the Expected Mean Squares for Treatment and Error are functions of the sample sizes (b, the number of blocks), the true treatment effects (

a1,…,at) and the variance of the random error terms (s

2)By assigning all treatments to units within blocks, error variance is (much) smaller for RBD than CRD (which combines block variation&random error into error term)Relative Efficiency of RBD to CRD (how many times as many replicates would be needed for CRD to have as precise of estimates of treatment means as RBD does):Slide37

Example - Caffeine and Endurance

Treatments:

t=4 Doses of Caffeine: 0, 5, 9, 13 mgBlocks: b

=9 Well-conditioned cyclistsResponse: yij=Minutes to exhaustion for cyclist j @ dose

iData:Slide38
Slide39

Example - Caffeine and EnduranceSlide40

Example - Caffeine and EnduranceSlide41

Example - Caffeine and EnduranceSlide42

Example - Caffeine and Endurance

Would have needed 3.79 times as many cyclists per dose to have the same precision on the estimates of mean endurance time.

9(3.79)

 35 cyclists per dose

4(35) = 140 total cyclistsSlide43

RBD -- Non-Normal Data

Friedman’s Test

When data are non-normal, test is based on ranksProcedure to obtain test statistic:Rank the k

treatments within each block (1=smallest, k=largest) adjusting for tiesCompute rank sums for treatments (Ti) across blocks

H0: The k populations are identical (m1=...=mk)HA

: Differences exist among the

k

group meansSlide44

Example - Caffeine and EnduranceSlide45

Latin Square Design

Design used to compare

t treatments when there are two sources of extraneous variation (types of blocks), each observed at t levelsBest suited for analyses when

t  10Classic Example: Car Tire ComparisonTreatments: 4 Brands of tires (A,B,C,D)

Extraneous Source 1: Car (1,2,3,4)Extraneous Source 2: Position (Driver Front, Passenger Front, Driver Rear, Passenger Rear) Slide46

Latin Square Design - Model

Model (

t treatments, rows, columns, N=t2

) : Slide47

Latin Square Design - ANOVA &

F-Test

H

0

:

a

1

= … =

a

t

= 0

H

a

: Not all

a

k

= 0

TS:

F

obs

=

MST

/

MSE

= (SST/(

t-1))/(SSE/((t

-1)(

t

-2)))

RR:

F

obs

F

a

,

t

-1

,

(

t

-1)(

t

-2)Slide48

Pairwise Comparison of Treatment Means

Tukey’s Method-

q in Studentized Range Table with n = (

t-1)(t-2)

Bonferroni’s Method -

t

-values from table on class website with

n

= (

t

-1)(

t

-2) and

C

=

t

(

t

-1)/2Slide49

Expected Mean Squares / Relative Efficiency

Expected Mean Squares: As with CRD, the Expected Mean Squares for Treatment and Error are functions of the sample sizes (t, the number of blocks), the true treatment effects (

a1,…,at) and the variance of the random error terms (s

2)By assigning all treatments to units within blocks, error variance is (much) smaller for LS than CRD (which combines block variation&random error into error term)Relative Efficiency of LS to CRD (how many times as many replicates would be needed for CRD to have as precise of estimates of treatment means as LS does):Slide50

Power Approach to Sample Size Choice – R CodeSlide51

2-Way ANOVA

2 nominal or ordinal factors are believed to be related to a quantitative response

Additive Effects: The effects of the levels of each factor do not depend on the levels of the other factor.Interaction: The effects of levels of each factor depend on the levels of the other factorNotation:

mij is the mean response when factor A is at level i and Factor B at jSlide52

2-Way ANOVA - Model

Model depends on whether all levels of interest for a factor are included in experiment:

Fixed Effects:

All levels of factors A and B included

Random Effects:

Subset of levels included for factors A and B

Mixed Effects:

One factor has all levels, other factor a subsetSlide53

Fixed Effects Model

Factor A: Effects are fixed constants and sum to 0

Factor B: Effects are fixed constants and sum to 0Interaction: Effects are fixed constants and sum to 0 over all levels of factor B, for each level of factor A, and vice versaError Terms: Random Variables that are assumed to be independent and normally distributed with mean 0, variance

se2 Slide54

Example - Thalidomide for AIDS

Response: 28-day weight gain in AIDS patients

Factor A: Drug: Thalidomide/PlaceboFactor B: TB Status of Patient: TB+/TB-

Subjects: 32 patients (16 TB+ and 16 TB-). Random assignment of 8 from each group to each drug). Data:Thalidomide/TB+

: 9,6,4.5,2,2.5,3,1,1.5Thalidomide/TB-: 2.5,3.5,4,1,0.5,4,1.5,2Placebo/TB+: 0,1,-1,-2,-3,-3,0.5,-2.5Placebo/TB-: -0.5,0,2.5,0.5,-1.5,0,1,3.5Slide55

ANOVA Approach

Total Variation (

TSS) is partitioned into 4 components:Factor A: Variation in means among levels of AFactor B: Variation in means among levels of BInteraction: Variation in means among combinations of levels of A and B that are not due to A or B alone

Error: Variation among subjects within the same combinations of levels of A and B (Within SS)Slide56

Analysis of Variance

TSS = SSA + SSB + SSAB + SSE

df

Total

= df

A

+ df

B

+ df

AB

+ df

E

Slide57

ANOVA Approach - Fixed Effects

Procedure:

First test for interaction effects

If interaction test not significant, test for Factor A and B effectsSlide58

Example - Thalidomide for AIDS

Individual Patients

Group MeansSlide59

Example - Thalidomide for AIDS

There is a significant Drug*TB interaction (F

DT

=5.897, P=.022)

The Drug effect depends on TB status (and vice versa)Slide60

Comparing Main Effects (No Interaction)

Tukey’s Method-

q in Studentized Range Table with n =

ab(r-1)

Bonferroni’s Method -

t

-values in Bonferroni table with

n

=

ab

(

r

-1)Slide61

Comparing Main Effects (Interaction)

Tukey’s Method-

q in Studentized Range Table with n =

ab(r-1)

Bonferroni’s Method -

t

-values in Bonferroni table with

n

=

ab

(

r

-1)Slide62

Miscellaneous Topics

2-Factor ANOVA can be conducted in a Randomized Block Design, where each block is made up of

ab experimental units. Analysis is direct extension of RBD with 1-factor ANOVAFactorial Experiments can be conducted with any number of factors. Higher order interactions can be formed (for instance, the

AB interaction effects may differ for various levels of factor C). When experiments are not balanced, calculations are immensely messier and you must use statistical software packages for calculationsSlide63

Unequal Sample Sizes

When sample sizes are unequal, calculations and parameter interpretations (especially marginal ones) become messier

Observational studies often have unequal sample sizes due to availability of sampling units for certain combinations of factor levels (villagers of certain types in a rural study for instance)

Experimental studies, even when planned with equal sample sizes can end up unbalanced through technical problems or “drop outs”

Some conditions may be cheaper to measure than others, and will have larger sample sizesSome situations have particular contrasts of higher importanceSlide64

Regression Approach - ISlide65

Regression Approach - IISlide66

Regression Approach – Example ISlide67

Testing Strategies – Models Fit

Model 1: all Factor A, Factor B, and Interaction AB Effects

Model 2:all Factor A, Factor B Effects (Remove Interaction)

Model 3: all Factor B,Interaction AB Effects (Remove A)Model 4:all Factor A,Interaction AB Effects (Remove B)

To test for Interaction Effects, Model 1 is Full Model, Model 2 is Reduced dfNumerator=(a-1)(b-1) dfden=nT-ab

Testing for Factor A Effects, Full=Model 1, Reduced=Model 3

df

Numerator

=(a-1)

dfden=

n

T

-ab

Testing for Factor B Effects, Full=Model 1, Reduced=Model 4

df

Numerator=(b-1) dfden

=nT-abSlide68

Regression Approach – Example - ContinuedSlide69

Regression Approach – Example - ContinuedSlide70

Regression Approach – Example - ContinuedSlide71

Estimating Treatment and Factor Level Means/ContrastsSlide72

Standard Error MultipliersSlide73

Creative Life Cycles – Comparing Treatment Means

Conceptualists/Poets Conceptualists/Novelists Experimentalists/Poets Experimentalists/NovelistsSlide74

Creative Life Cycles – Comparing Factor Level MeansSlide75

1-Way Random Effects ModelSlide76

Randomized Complete Block Designs – Subjects as Blocks

Test for differences among treatment effects:

H

0

:

a

1

= ... =

a

t

=

0

H

A

: Not all

a

i

= 0

TS: F = MST/MSE

RR: F ≥ Fa;t-1,(t-1)(b-1)Slide77

Mixed Effects Models

Assume:

Factor A Fixed (All levels of interest in study)a1

+ a2 + … +aa

= 0Factor B Random (Sample of levels used in study)bj ~ N(0,sb2) (Independent)AB Interaction terms Random(ab)

ij

~ N(0

,s

ab

2) (Independent)Analysis of Variance is computed exactly as in Fixed Effects case (Sums of Squares, df’s, MS’s)

Error terms for tests change (See next slide).Slide78

Expected Mean Squares for 2-Way ANOVASlide79

ANOVA Approach – Mixed Effects

Procedure:

First test for interaction effects

If interaction test not significant, test for Factor A and B effectsSlide80

Comparing Main Effects for A (No Interaction)

Tukey’s Method-

q in Studentized Range Table with n = (

a-1)(b-1)

Bonferroni’s Method -

t

-values in Bonferroni table with

n

= (

a

-1)(

b

-1)Slide81

Random Effects Models

Assume:

Factor A Random (Sample of levels used in study)ai ~ N(0,

sa2) (Independent)Factor B Random (Sample of levels used in study)

bj ~ N(0,sb2) (Independent)AB Interaction terms Random(ab)ij ~ N(0,s

ab

2

)

(Independent)

Analysis of Variance is computed exactly as in Fixed Effects case (Sums of Squares, df’s, MS’s)Error terms for tests change (See next slide).Slide82

ANOVA Approach – Mixed Effects

Procedure:

First test for interaction effects

If interaction test not significant, test for Factor A and B effectsSlide83

Nested Designs

Designs where levels of one factor are nested (as opposed to crossed) wrt other factor

Examples Include:Classrooms nested within schoolsLitters nested within Feed VarietiesHair swatches nested within shampoo types

Swamps of varying sizes (e.g. large, medium, small)Restaurants nested within national chainsSlide84

Nested Design - ModelSlide85

Nested Design - ANOVASlide86

Factors A and B FixedSlide87

Comparing Main Effects for A

Tukey’s Method-

q in Studentized Range Table with n = (

r-1)Sbi

Bonferroni’s Method -

t

-values in Bonferroni table with

n

= (

r

-1)

S

b

iSlide88

Comparing Effects for Factor B Within A

Tukey’s Method-

q in Studentized Range Table with n = (

r-1)Sbi

Bonferroni’s Method -

t

-values in Bonferroni table with

n

= (

r

-1)

S

b

iSlide89

Factor A Fixed and B RandomSlide90

Comparing Main Effects for A (B Random)

Tukey’s Method-

q in Studentized Range Table with n =

Sbi-a

Bonferroni’s Method -

t

-values in Bonferroni table with

n

=

S

b

i

-

aSlide91

Factors A and B RandomSlide92

Elements of Split-Plot Designs

Split-Plot Experiment: Factorial design with at least 2 factors, where experimental units wrt factors differ in “size” or “observational points”.

Whole plot: Largest experimental unitWhole Plot Factor: Factor that has levels assigned to whole plots. Can be extended to 2 or more factorsSubplot: Experimental units that the whole plot is split into (where observations are made)

Subplot Factor: Factor that has levels assigned to subplotsBlocks: Aggregates of whole plots that receive all levels of whole plot factorSlide93

Split Plot Design

Note: Within each block we would assign at random the 3 levels of A to the whole plots and the 4 levels of B to the subplots within whole plotsSlide94

Examples

Agriculture: Varieties of a crop or gas may need to be grown in large areas, while varieties of fertilizer or varying growth periods may be observed in subsets of the area.

Engineering: May need long heating periods for a process and may be able to compare several formulations of a by-product within each level of the heating factor.Behavioral Sciences: Many studies involve repeated measurements on the same subjects and are analyzed as a split-plot (See Repeated Measures lecture)Slide95

Design Structure

Blocks:

b groups of experimental units to be exposed to all combinations of whole plot and subplot factorsWhole plots: a experimental units to which the whole plot factor levels will be assigned to at random within blocks

Subplots: c subunits within whole plots to which the subplot factor levels will be assigned to at random.Fully balanced experiment will have n=abc

observationsSlide96

Data Elements (Fixed Factors, Random Blocks)

Y

ijk: Observation from wpt i, block j

, and spt k m : Overall mean level

a i : Effect of ith level of whole plot factor (Fixed) bj: Effect of jth block (Random) (ab )ij

: Random error corresponding to whole plot elements in block

j

where wpt

i

is applied g

k

: Effect of k

th

level of subplot factor (Fixed)

(ag )ik: Interaction btwn wpt i and spt k

(bc )jk: Interaction btwn block j and spt

k

(often set to 0)

e

ijk

: Random Error= (

bc

)jk+ (abc )ijk

Note that if block/spt interaction is assumed to be 0, e represents the block/spt within wpt interaction Slide97

Model and Common Assumptions

Y

ijk = m +

a i + b j + (ab )

ij + g k + (ag )ik + e ijkSlide98

Tests for Fixed EffectsSlide99

Comparing Factor LevelsSlide100

Repeated Measures Designs

a

Treatments/Conditions to compareN subjects to be included in study (each subject will receive only one treatment)n subjects receive trt

i: an = Nt time periods of data will be obtainedEffects of trt, time and trtxtime interaction of primary interest.Between Subject Factor: Treatment

Within Subject Factors: Time, TrtxTimeSlide101

Model

Note the random error term is actually the interaction between subjects (within treatments) and timeSlide102

Tests for Fixed EffectsSlide103

Comparing Factor Levels