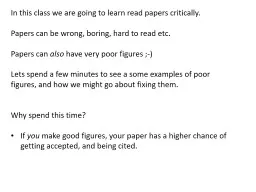
Papers can be wrong boring hard to read etc Papers can also have very poor figures Lets spend a few minutes to see a some examples of poor figures and how we might go about fixing them ID: 554961
Download Presentation The PPT/PDF document "In this class we are going to learn read..." is the property of its rightful owner. Permission is granted to download and print the materials on this web site for personal, non-commercial use only, and to display it on your personal computer provided you do not modify the materials and that you retain all copyright notices contained in the materials. By downloading content from our website, you accept the terms of this agreement.
Slide1
In this class we are going to learn read papers critically.
Papers can be wrong, boring, hard to read etc.
Papers can
also
have very poor figures ;-)
Lets spend a few minutes to see a some examples of poor figures, and how we might go about fixing them.
Why spend this time?
If
you
make good figures, your paper has a higher chance of getting accepted, and being cited. Slide2
Lettering too small and font difficult to read
Here the font size on the legend and key is about 1mm.
(coin for scale)Slide3
Key outside the graph (indirection)
Here the problem is not that the key is in
text
format (although it does not help). The problem is the distance between the key and the data.
Data
KeySlide4
Unnecessary numbers in the axis
Do we really need every integer from zero to 25 in this chart?
(if “yes”, then make a table, not a figure)
In this version, I can still find, say “23”, by locating 20 and counting three check marks.
This problem is more common in the X-axisSlide5
In the following slides is a figure one of my students made.
I keep prodding her, until I was happy with the figure.Lets see how that worked…Slide6
4
6
8
10
12
14
16
18
20
500
1000
1500
2000
2500
0
Figure 17. The true positives (green/left) and true negatives (red/right) for the fish problem. Slide7
4
6
8
10
12
14
16
18
20
500
1000
1500
2000
2500
0
Figure 17. The true positives (green/left) and true negatives (red/right) for the fish problem.
What does the bounding box do for us?
Lets get rid of it.Slide8
4
6
8
10
12
14
16
18
20
500
1000
1500
2000
2500
0
Figure 17. The true positives (green/left) and true negatives (red/right) for the fish problem. Slide9
4
6
8
10
12
14
16
18
20
500
1000
1500
2000
2500
0
It is hard to read the heights (or existence) of very small bars because they are so close to the axisSlide10
4
6
8
10
12
14
16
18
20
500
1000
1500
2000
2500
0
Solution: “explode” away the X-axis.
2Slide11
4
6
8
10
12
14
16
18
20
500
1000
1500
2000
2500
0
Do we need the black outline around the bars?
2Slide12
4
6
8
10
12
14
16
18
20
500
1000
1500
2000
2500
0
The figure looks better without them, especially if the histogram is resized small for a paper.
2Slide13
4
6
8
10
12
14
16
18
20
500
1000
1500
2000
2500
0
Hmm.. Did we choose the right bucket size for the data?
2
2
4
6
8
10
12
14
0
500
1000
1500
2000
2500
3000
3500
4000
4500
2
4
6
8
10
12
14
0
100
200
300
400
500
600
700
800
900
2
4
6
8
10
12
14
0
50
100
150
200
250
300
There is no reason to think the default in Matlab or Excel is correct for your data….
Too coarse
Too fine
About rightSlide14
One distribution obscures the other.
0
200
400
600
0
2
4
8
10
12
14
16
18
20
6Slide15
We can use transparent colors
0
200
400
600
0
2
4
8
10
12
14
16
18
20
6Slide16
Does the Y-axis need to be there? Sometimes it is irrelevant and if so, remove it.
0
200
400
600
0
2
4
8
10
12
14
16
18
20
6Slide17
Our figure caption tells us what we are looking at, that is good. It even uses
color/location so that it will work in grayscale.
However, why not remove some indirection… 0
24
8
10
12
14
16
18
20
6
Figure 17. The true positives (
green/left
) and true negatives (
red/right
) for the fish problem. Slide18
This is better. ..
Do we even need the arrows?
0
24
8
10
12
14
16
18
20
6
true positives
false positives
Figure 17. The results for the fish problem. Slide19
0
2
4
8
10
12
14
16
18
20
6
true positives
false positives
Figure 17. The results for the fish problem. Slide20
0
2
4
8
10
12
14
16
18
20
6
true positives
false positives
Figure 17. The results for the fish problem.
4
6
8
10
12
14
16
18
20
500
1000
1500
2000
2500
0
Figure 17. The true positives (green/left) and true negatives (red/right) for the fish problem.