PPT-Supplemental Figure 4
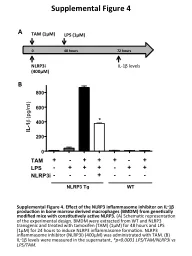
TAM 1µM 72 hours IL1β levels 48 hours LPS 1µM 0 A NLRP3i 400μM B Supplemental Figure 4 Effect of the NLRP3 inflammasome inhibitor on IL1β production in bone
Download Presentation
"Supplemental Figure 4" is the property of its rightful owner. Permission is granted to download and print materials on this website for personal, non-commercial use only, provided you retain all copyright notices. By downloading content from our website, you accept the terms of this agreement.
Presentation Transcript
Transcript not available.