/
Tweet Emotion Mapping: Understanding US Emotions  in Time and Space Tweet Emotion Mapping: Understanding US Emotions  in Time and Space

Tweet Emotion Mapping: Understanding US Emotions in Time and Space - PowerPoint Presentation

lois-ondreau
lois-ondreau . @lois-ondreau
Follow
344 views
Uploaded On 2019-11-06

Tweet Emotion Mapping: Understanding US Emotions in Time and Space - PPT Presentation

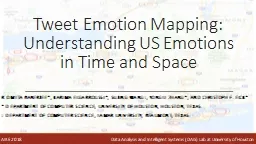
Tweet Emotion Mapping Understanding US Emotions in Time and Space Romita Banerjee Karima Elgarroussi Sujing Wang Yongli Zhang and Christoph F Eick Department of Computer Science University of Houston Houston Texas ID: 763748

analysis data lab university data analysis university lab dais systems intelligent 2018 houston aike density emotion clustering spatial weighted

Share:

Link:

Embed:

Download Presentation from below link

Download Presentation The PPT/PDF document "Tweet Emotion Mapping: Understanding US ..." is the property of its rightful owner. Permission is granted to download and print the materials on this web site for personal, non-commercial use only, and to display it on your personal computer provided you do not modify the materials and that you retain all copyright notices contained in the materials. By downloading content from our website, you accept the terms of this agreement.


Presentation Transcript

Tweet Emotion Mapping: Understanding US Emotions in Time and Space Romita Banerjee*, Karima Elgarroussi*, Sujing Wang!, Yongli Zhang*, and Christoph F. Eick**Department of Computer Science, University of Houston, Houston, Texas!Department of Computer Science, Lamar University, Beaumont, Texas Data Analysis and Intelligent Systems (DAIS) Lab at University of Houston AIKE 2018

Outline Related WorkIntroductionGoalsSystem ArchitectureSpatial Clustering ComponentEmotion Weighted Density EstimationSpatial Clustering ApproachConclusionFuture Work Data Analysis and Intelligent Systems (DAIS) Lab at University of Houston AIKE 2018

Outline Related WorkIntroductionGoalsSystem ArchitectureSpatial Clustering ComponentEmotion Weighted Density EstimationSpatial Clustering ApproachConclusionFuture Work Data Analysis and Intelligent Systems (DAIS) Lab at University of Houston AIKE 2018

Source: https://github.com/pubnub/tweet-emotion Data Analysis and Intelligent Systems (DAIS) Lab at University of HoustonAIKE 2018

http://hedonometer.org/index.html Data Analysis and Intelligent Systems (DAIS) Lab at University of Houston AIKE 2018

UN World Happiness Report UN World Happiness Report ranks 156 countries by their happiness levels. Citizens are asked to fill out questionnaires that inquire six key variables that are believed to play a key role for measuring happiness: well-being: income, healthy life expectancy, social support, freedom, trust, and generosity. Data Analysis and Intelligent Systems (DAIS) Lab at University of Houston AIKE 2018

Outline Related WorkIntroductionGoalsSystem ArchitectureSpatial Clustering ComponentEmotion Weighted Density EstimationSpatial Clustering ApproachConclusionFuture Work Data Analysis and Intelligent Systems (DAIS) Lab at University of Houston AIKE 2018

Importance of Emotion Analysis Emotions are an integral part of human nature and it influences how we think or behave.Emotions can be expressed by facial expressions, actions or electronically like using emojis, likes and dislikes, and tweets.Assessing the emotional well being of population is one of the core aspect of many fields like medicine, psychology, etc.It can help in evaluating how a population feels after a event. https://en.wikipedia.org/wiki/Emotion Data Analysis and Intelligent Systems (DAIS) Lab at University of Houston AIKE 2018

Research Focus Our paper presents a new framework for tweet emotion mapping and emotion change analysis. It focuses on the development of data analysis framework that measures and summarizes the emotional well-being of population as well as how it evolves over time.Ultimately, we plan to provide storytelling capabilities that tells the story of emotion evolution of a region.As Twitter is one of the most popular social media platform, we are using tweets as our primary knowledge source. Data Analysis and Intelligent Systems (DAIS) Lab at University of Houston AIKE 2018

Outline Related WorkIntroductionGoalsSystem ArchitectureSpatial Clustering ComponentEmotion Weighted Density EstimationSpatial Clustering ApproachConclusionFuture Work Data Analysis and Intelligent Systems (DAIS) Lab at University of Houston AIKE 2018

Goals of the Research Project Identify the regions with highly positive and highly negative emotions.To monitor the change of emotions of the previously identified regions over time.To provide storytelling capabilities that demonstrates the emotional evolution of a region using animations and graphics.Data Analysis and Intelligent Systems (DAIS) Lab at University of Houston AIKE 2018

Outline Related WorkIntroductionGoalsSystem ArchitectureSpatial Clustering ComponentEmotion Weighted Density EstimationSpatial Clustering ApproachConclusionFuture Work Data Analysis and Intelligent Systems (DAIS) Lab at University of Houston AIKE 2018

Data Analysis and Intelligent Systems (DAIS) Lab at University of Houston Emotion Mapping and Change Analysis System AIKE 2018

System Architecture The entire system can be broadly divided into three parts:Frontend: Spatial Clustering ComponentBackend: Change Analysis FrameworkData StorytellingData Analysis and Intelligent Systems (DAIS) Lab at University of HoustonAIKE 2018

Change Analysis Framework Monitors change by comparing sets of polygons which represent spatial clusters for a particular time window/batch.Each spatial cluster belongs to a single batch. Change of emotions is then analyzed with respect to a set of unary and binary change predicates that are evaluated with respect to the set of spatial clusters. AIKE 2018 Data Analysis and Intelligent Systems (DAIS) Lab at University of Houston

Change Analysis Framework Input: Sequence of Sets of Spatial Clusters and their statistical summaries.Output: An emotion change graph is obtained whose nodes are spatial clusters and whose edges capture different types of temporal relationships between spatial clusters. Data Analysis and Intelligent Systems (DAIS) Lab at University of Houston AIKE 2018

Importance of Data Storytelling Good stories are always engaging.Successful companies have long been crafting ‘authentic’ stories to sell their products, entertain, and build brands.Data storytelling should make a point; to offer direction or to sell an audience on a course of action.As data gets bigger and more complex, being able to tell a compelling story becomes more important than ever. For that reason, good storytelling is becoming an ever more vital component. AIKE 2018 Data Analysis and Intelligent Systems (DAIS) Lab at University of Houston

Data Storytelling Data storytelling is a combination of three key elements: data, visuals, and narrative.When narrative is coupled with data: it helps to explain to your audience what’s happening in the data and why a particular insight is important. When visuals are applied to data, they can enlighten the audience to insights that they wouldn’t see without charts or graphs.When narrative and visuals are merged together, they can  engage or even entertain an audience.  Data Analysis and Intelligent Systems (DAIS) Lab at University of Houston AIKE 2018

Source: https://www.forbes.com/sites/brentdykes/2016/03/31/data-storytelling-the-essential-data-science-skill-everyone-needs/#7371fb2a52ad Data Analysis and Intelligent Systems (DAIS) Lab at University of HoustonAIKE 2018

Outline Related WorkIntroductionGoalsSystem ArchitectureSpatial Clustering ComponentEmotion Weighted Density EstimationSpatial Clustering ApproachConclusionFuture Work Data Analysis and Intelligent Systems (DAIS) Lab at University of Houston AIKE 2018

Data Analysis and Intelligent Systems (DAIS) Lab at University of Houston AIKE 2018

Data Analysis and Intelligent Systems (DAIS) Lab at University of Houston AIKE 2018

Outline Related WorkIntroductionGoalsSystem ArchitectureSpatial Clustering ComponentEmotion Weighted Density EstimationSpatial Clustering ApproachConclusionFuture Work Data Analysis and Intelligent Systems (DAIS) Lab at University of Houston AIKE 2018

Emotion-Weighted Density Estimation Input: Given a set of objects O (<location>,<emotion-value>). Output: A 2-dimensional continuous density function O(v) that takes negative and positive values at location (v).Traditional density estimation techniques consider only the spatial dimension of data points ignoring non-spatial information. Our approach differs from the traditional density estimation by additionally considering a non-spatial, continuous variable of interest in its influence function. Data Analysis and Intelligent Systems (DAIS) Lab at University of Houston AIKE 2018

Emotion-Weighted Density Estimation The influence of object “o” on “v” is measured as the product of emotional score and a Gaussian kernel density function: The accumulated influence of all data objects ∈O on a “query” point v is used to define a density function (v) as follows:     Data Analysis and Intelligent Systems (DAIS) Lab at University of Houston AIKE 2018

Emotion-Weighted Density Estimation The influence of tweets far away from the query point is less than the influence tweets nearby.Very positive or negative emotion tweets, having very high/low emotion values, have a stronger influence than tweets whose emotion values close to 0.If O(v)0, there are two possible scenarios: There is a balance of negative and positive emotions in query point.The query point is in a very sparse area with respect to tweets and therefore has a low density. Data Analysis and Intelligent Systems (DAIS) Lab at University of Houston AIKE 2018

Outline Related WorkIntroductionGoalsSystem ArchitectureSpatial Clustering ComponentEmotion Weighted Density EstimationSpatial Clustering ApproachConclusionFuture Work Data Analysis and Intelligent Systems (DAIS) Lab at University of Houston AIKE 2018

Overview Input: location and time were and when the tweets were posted and an emotion assessment score in [-1, +1], with +1 denoting a very positive emotion and -1 a very negative emotion.Output: Spatial cluster polygons such that all values of the density inside the polygon are either above 1 (positive emotion cluster) or below 2 (negative emotion cluster). Data Analysis and Intelligent Systems (DAIS) Lab at University of Houston AIKE 2018

Preprocessing Data Date, location and the text of each tweet Data Analysis and Intelligent Systems (DAIS) Lab at University of Houston Tweet Ids Emotional Score VADER AIKE 2018 twarc

Obtaining Spatial Clusters Divide the batches of data into a number of grids. The batches can be daily, weekly or monthly.Using the spatial density function, we calculate the density values for all the grid intersection points. Using the product of the density values with the emotional scores for all intersection points as an input, we compute the contour lines for the density thresholds.Using the obtained contour lines, create spatial clusters which in our approach are polygons.Challenges of creating spatial clusters include:creating closed contour lines for open contour lines that lie on the boundary of the observation areadistinguishing between holes and spatial clustersremoving small and insignificant clusters. Data Analysis and Intelligent Systems (DAIS) Lab at University of Houston AIKE 2018

Data Analysis and Intelligent Systems (DAIS) Lab at University of Houston AIKE 2018

Data Analysis and Intelligent Systems (DAIS) Lab at University of Houston AIKE 2018Positive Emotion Clusters in the New York City/Long Island Area on June 1 and on 2, 2014

Outline Related WorkIntroductionGoalsSystem ArchitectureSpatial Clustering ComponentEmotion Weighted Density EstimationSpatial Clustering ApproachConclusionFuture Work Data Analysis and Intelligent Systems (DAIS) Lab at University of Houston AIKE 2018

Conclusion We introduced a novel spatio-temporal framework creates positive and negative emotion spatial clusters and summarizes the change of emotions in time.The framework creates such clusters by using contouring algorithm that operates on an emotion-weighted density function.As per our knowledge our density estimation approach is unique in the sense that it considers a non-spatial, continuous variable of interest in the influence function. Data Analysis and Intelligent Systems (DAIS) Lab at University of Houston AIKE 2018

Outline Related WorkIntroductionGoalsSystem ArchitectureSpatial Clustering ComponentEmotion Weighted Density EstimationSpatial Clustering ApproachConclusionFuture Work Data Analysis and Intelligent Systems (DAIS) Lab at University of Houston AIKE 2018

Future Work Conducting a thorough experimental evaluation of the Frontend system.Enhancement of the implementation of the Spatial Clustering Component including:Tools to preselect critical input parameters such as bandwidth, grid sizes and density thresholds Make the implementation more scalable to be able to deal with a large number of tweetsAddressing the challenges faced during spatial cluster creationDesign and implementation of the Data Storytelling Component and the implementation of the Change Analysis Component. Contributing to the next United Nations’ Happiness Report. AIKE 2018 Data Analysis and Intelligent Systems (DAIS) Lab at University of Houston

Thank You! Data Analysis and Intelligent Systems (DAIS) Lab at University of HoustonAIKE 2018