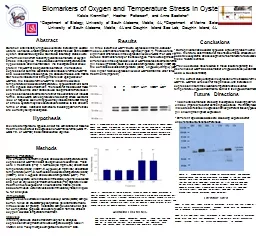
/
Biomarkers of Oxygen and Temperature Stress in Oysters Biomarkers of Oxygen and Temperature Stress in Oysters

Biomarkers of Oxygen and Temperature Stress in Oysters - PowerPoint Presentation

luanne-stotts
luanne-stotts . @luanne-stotts
Follow
372 views
Uploaded On 2017-12-06

Biomarkers of Oxygen and Temperature Stress in Oysters - PPT Presentation

Kelsie Kronmiller 1 Heather Patterson 2 and Anne Boettcher 1   1 Department of Biology University of South Alabama Mobile AL 2 Department of Marine Sciences University of South Alabama Mobile AL and Dauphin Island Sea Lab Dauphin Island AL ID: 612819

expression temperature elevated hypoxia temperature expression hypoxia elevated gill treatments stress oxygen hsp70 virginica reef sand treatment ambient figure

Share:

Link:

Embed:

Download Presentation from below link

Download Presentation The PPT/PDF document "Biomarkers of Oxygen and Temperature Str..." is the property of its rightful owner. Permission is granted to download and print the materials on this web site for personal, non-commercial use only, and to display it on your personal computer provided you do not modify the materials and that you retain all copyright notices contained in the materials. By downloading content from our website, you accept the terms of this agreement.


Presentation Transcript

Slide1

Biomarkers of Oxygen and Temperature Stress in Oysters Kelsie Kronmiller1, Heather Patterson2, and Anne Boettcher1 1Department of Biology, University of South Alabama, Mobile, AL; 2Department of Marine Sciences, University of South Alabama, Mobile, AL and Dauphin Island Sea Lab, Dauphin Island, AL

ACKNOWLEDGEMENTSWe thank the National Science Foundation, Dauphin Island Sea Lab, and USA Oyster Restoration Program for funding for this project. We would also like to thank Julio Turrens, Ruth Carmichael, Tim Sherman, Emily Boone, and Jessica Dean for comments and laboratory assistance.

Conclusions Eutrophication and coastal hypoxia is a growing problem world wide, therefore, determination of the effects of these stressors on coastal ecosystems and development of biomarkers for detection of these factors is critical. Previous studies have resulted in mixed results regarding the usefulness of HSP70 as a biomarker of hypoxia stress (Ueda 2006, Ueda & Boettcher 2009). In the current study, changes in expression of the inducible form or HSP70, HSP69 were seen for the gill tissue, with increases in expression in both the elevated temperature and elevated temperature+ hypoxia treatments, but not in the hypoxia treatment.

MethodsSample PreparationThe effects of short-term hypoxia and elevated temperature on the expression of HSP70 in adult C. virginica were examined. There were 4 treatments (n=5): 1. Normoxia (>9 mg/mL O2) and ambient temperature (26 C) (AOAT), 2. Hypoxia (<2 mg/ml O2) and ambient temperature (HAT), 3. Normoxia and elevated temperature (36 C) (AOET), and 4. Hypoxia and elevated temperature (HET). Pre-exposure oysters were harvested immediately upon field collection and put on dry ice as pre-treatment controls (T0). Oysters in each treatment were exposed for 4 hours and the mantle, gill and adductor muscle were harvested and immediately frozen in liquid N2 for analyses. ImmunoblotsSamples were extracted in sodium dodecyl sulfate (SDS) sample buffer, run on an 8% SDS-polyacrylamide gel and transferred to nitrocellulose for probing. A standard sample was run on all gels for comparative purposes and was replicate 2 from the ambient oxygen elevated temperature treatment. AnalysisIntensity data was arcsine transformed prior to analyses, expression among treatments was compared using a Model 1 ANOVA and Tukey multiple comparison test with α = 0.05.

Abstract

Duration and intensity of hypoxic events are increasing in coastal waters worldwide, creating stress for organisms such as the Eastern oyster, Crassostrea virginica. Controlled laboratory studies were performed in an effort to identify potential biomarkers of oxygen stress in C. virginica. These studies examined temperature and hypoxia alone and in combination. We investigated heat shock protein 70 (HSP70) as a potential biomarker. We measured expression of both the constitutive and inducible forms of HSP70 and looked at three tissue types, gill, adductor muscle, and mantle. Our results indicate that in the gill there is an upregulation of HSP69, the inducible form of HSP70, in both the elevated temperature and elevated temperature + hypoxia treatment, but not in the hypoxia alone treatment. The results for the abductor muscle and mantle on the other hand showed no significant differences in expression across treatments for either the constitutive or inducible forms. Since HSPs serve a protective role during stress events, the lack of response seen with hypoxia may indicate that under this type of stress, oysters may have decreased resistance to this and other forms of stress. Additional biomarkers, including p38-MAP kinase are currently being investigated.

HypothesisElevated temperature, hypoxia, and/or the combination of these two treatments will affect the expression of HSP70 isoforms (HSC 77, HSC 72, or HSP69) in adult Crassostrea virginica.

Figure 1. Model Western blot probed for HSP70. The three isoforms of HSP70, HSC77, HSC72 and HSP69 are indicated by the numbers on the right hand side of the image. These samples were taken from adult

C. virginica

gills. The lanes indicate the standard control used in all blots (S), time zero (T0), normal oxygen and normal temperature (AOAT), normal temperature with hypoxic oxygen (HAT), normal oxygen with elevated temperature (AOET), and elevated temperature with hypoxic oxygen (HET).

Figure 2. Comparison of relative intensities (mean ± STDV) of HSP69 expression in adult

C. virginica gill across five treatments. Treatments are time zero pre-treatment (T0), ambient oxygen (>9 mg/L) + ambient temperature (26 C) (AOAT), hypoxia (<2 mg/L) + ambient temperature (HAT), ambient oxygen + elevated temperature (36 C) (AOET), and hypoxia + elevated temperature (HET). Error bar indicates 1 STDV. Different letters above the error bar indicate significant difference at p<0.05.

Results

All three isoforms of HSP 70 were expressed in the gill, adductor muscle, and mantle of adult C. virginica (Figure 1). There were no significant differences in the expression levels of HSC 77 or HSC 72 across treatments for any of the tissue types. There were significant differences in the expression level of HSP 69 across treatments for the gill tissue (p=0.005). Both the elevated temperature (36 C) (AOET) and the combined elevated temperature (36 C) + hypoxia (<2 mg/L) (HET) had higher relative expression levels of HSP 69 than the other three treatments (Figure 2).

T0

S

AOAT

HAT

AOET

HET

Literature Cited

Ueda, N. 2006. Heat shock protein 70 expression in larval and spat stages of the Eastern oyster,

Crassostrea virginica: changes during early like development and in response to environmental stress. Ueda N. & A. Boettcher. 2009. Differences in heat shock protein 70 expression during larval and early spat development in the Eastern oyster, Crassostrea virginica (Gmelin, 1791). Cell Stress and Chaperones, 14: 439-443.

Future Directions Additional biomarkers are being investigated, including p38-MAP kinase (Figure 3) to better define hypoxic stress. Preliminary results indicate a difference in expression among different tissue types, with gill showing the highest expression. Different age classes/sizes are also being explored better understand ontogenetic differences.

Figure 3. Model Western blot probed for p38-MAP kinase. The phospho-p38-MAP kinase and the p38 MAP kinase are labeled at the right hand side. Samples were from field collected oysters exposed to periodic hypoxia (bottom and top of Sand Reef, Mobile Bay, AL, 7/10) and are Sand Reef bottom mantle (SBM), Sand Reef bottom gill (SBG), Sand Reef bottom adductor muscle (SBA), standard control used in all blots (S), Sand Reef top mantle (STM), Sand Reef top gill (STG), Sand Reef top adductor muscle (STA, sample expression below detection).