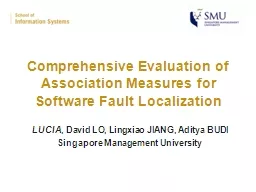
/
Comprehensive Evaluation of Association Measures for Softwa Comprehensive Evaluation of Association Measures for Softwa

Comprehensive Evaluation of Association Measures for Softwa - PowerPoint Presentation

luanne-stotts
luanne-stotts . @luanne-stotts
Follow
399 views
Uploaded On 2018-01-09

Comprehensive Evaluation of Association Measures for Softwa - PPT Presentation

LUCIA David LO Lingxiao JIANG Aditya BUDI Singapore Management University Introduction 2 Where is the fault A Buggy Program Automated Fault Localization Candidate of suspicious program elements ID: 621885

localization fault measures association fault localization association measures program ochiai tarantula execution spectrum test block failure cases cosine based

Share:

Link:

Embed:

Download Presentation from below link

Download Presentation The PPT/PDF document "Comprehensive Evaluation of Association ..." is the property of its rightful owner. Permission is granted to download and print the materials on this web site for personal, non-commercial use only, and to display it on your personal computer provided you do not modify the materials and that you retain all copyright notices contained in the materials. By downloading content from our website, you accept the terms of this agreement.


Presentation Transcript

Slide1

Comprehensive Evaluation of Association Measures for Software Fault Localization

LUCIA

, David LO, Lingxiao JIANG, Aditya BUDI

Singapore Management UniversitySlide2

Introduction

2

Where is

the fault ?

A Buggy Program

Automated

Fault Localization

Candidate of suspicious program elements

Test

Cases

FailureSlide3

Fault Localization Techniques

Many fault localization techniques have been proposed.

One family of techniques:

Spectrum-based fault localization

(Reps et.al, 1997)Use program spectra

(the representation of program behavior during execution)

3Slide4

An example of spectrum

4

Test CasesSlide5

Spectrum-based Fault Localization

Idea

Program element that frequently occurs in failed test case is likely to contain bug

Example of existing measures :Tarantula, Ochiai, etc.

5Slide6

Spectrum-based Fault Localization

6

Test CasesSlide7

Spectrum-based Fault Localization

Tarantula

(Jones and

Harrold

, 2005)Ochiai (

Abreu et.al, 2007)

7Slide8

Our Contributions #1

Tarantula &

Ochiai

model fault localization as the

association betweenThe execution of program elements with occurrence of fault

We model fault localization as the association betweenThe execution or

non-execution of program elements with occurrence of fault

8Slide9

Modeling Fault Localization with Association Measures

Suspiciousness score

of a program element

(e)

is defined using an association measure (M) as follows:A Non-control element

M(EXECUTION(e), FAILURE)

A Control element Maximum of M

(EXECUTION(e), FAILURE) and M

(Non-Execution(children of e), Failure)

9Slide10

Our Contributions #2

Evaluate the accuracies of 20 association measures for fault localization.

Evaluate their relative performance as compared to Tarantula and

Ochiai

.

10Slide11

Existing Association Measures (Tan et.al, 2002,

Geng

and Hamilton, 2006, Cheng et.al.,2009)

11

Associatio

n M.

1

Coefficient

2Odd Ratio

3Yule’s Q4

Yule ‘s Y5

Kappa6

J-Measure

7Gini Index

8

Support

9

Confidence

10

Laplace

Associatio

n M.

11

Conviction

12

Interest

13

Cosine

14

Piatetsky

-Shapiro

15

Certainty

Factor

16

Added Value

17

Collective

Strength

18

Jaccard

19

Klosgen

20

Information

GainSlide12

Modeling Fault Localization with Association Measures

12

Block 1

Execute

!Execute

Failed

1

0

Passed

3

0

Block 2

Execute

!ExecuteFailed

1

0

Passed

2

1Slide13

Modeling Fault Localization with Association Measures

13

Block 1

Execute

!Execute

Failed

1

0

Passed

30

Block 2Execute

!ExecuteFailed

10

Passed

2

1

e.g. Cosine

A=Execute, B=Failed

A=Execute, B=Failed

A=Not Execute

B=FailedSlide14

Modeling Fault Localization with Association Measures

14Slide15

Evaluation using Siemens Dataset

dad

15

Dataset

LOC

#Faulty

Versions

No. of Test Cases

Print_tokens

47254030Print_tokens2

399

104115

Replace512

315542

Schedule

292

9

2650

Schedule2

301

10

2710

Tcas

141

36

1608

Tot_Info

440

19

1052

Tota

l : 120 buggy versionsSlide16

Some measures are not as good as

Ochiai

and Tarantula.

16Slide17

Some measures are comparable

Ochiai

and Tarantula.

17Slide18

Improvement by Association Measure

18Slide19

Percentage of Inspected Elements

19Slide20

The Statistical Significance between Measures

20

Coefficient, Kappa, Confidence, Interest, Cosine,

Added Value,

Collective Strength , Jaccard,

Klosgen,Information Gain, Tarantula, Ochiai

Odd Ratio, Yule’s Q, Yule ‘s Y,

Support, Laplace, Conviction

Certainty FactorPiatetsky-Shapiro

Gini Index

J-MeasureSlide21

Summary of Findings

Fifty percent of the association measures have

good accuracies

for fault localization (28-34% inspected block)

Association measures that are statistically comparable with Ochiai and Tarantula are:

Coefficient, Kappa, Confidence, Interest, Cosine , Added Value, Collective Strength, Jaccard, Klosgen, Information Gain

Information Gain can localize more bugs as compare to Ochiai when 20-50% blocks are

inspected.

21Slide22

Threats to Validity

The effect of different granularity of instrumentation level

(

http://www.mysmu.edu/phdis2009/lucia.2009/Dataset.htm

)Dataset for experimentation is not a large program

22

Future Work

Investigate large real program

Investigate the effectiveness of the measures for different types of bugSlide23

THANK YOU

23