/
Global  climates and  natural  vegetation    Climate is average of weather conditions Global  climates and  natural  vegetation    Climate is average of weather conditions

Global climates and natural vegetation Climate is average of weather conditions - PowerPoint Presentation

luanne-stotts
luanne-stotts . @luanne-stotts
Follow
343 views
Uploaded On 2019-11-05

Global climates and natural vegetation Climate is average of weather conditions - PPT Presentation

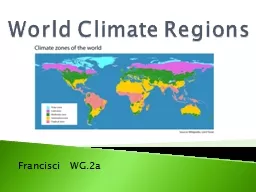
Global climates and natural vegetation Climate is average of weather conditions for 30 years Climatologists employ many different tools to organize the wealth of information about ID: 763640

climates climate vegetation classification climate climates classification vegetation climatic based precipitation regions heat water air conditions system potential urban

Share:

Link:

Embed:

Download Presentation from below link

Download Presentation The PPT/PDF document "Global climates and natural vegetatio..." is the property of its rightful owner. Permission is granted to download and print the materials on this web site for personal, non-commercial use only, and to display it on your personal computer provided you do not modify the materials and that you retain all copyright notices contained in the materials. By downloading content from our website, you accept the terms of this agreement.


Presentation Transcript

Global climates and natural vegetation

Climate is average of weather conditions for 30+ years Climatologists employ many different tools to organize the wealth of information about earth's climates to bring order and understanding graphs, classification systems, and maps are among the most common Temperature & Precipitation are the most important expressions of climate, and these have been used in Climographs (See above) and in climate classification schemes

Climate Classification Systems There are two fundamental types of classification used in modern climatology:Genetic classification, based on the causes or genesis of climatic variation Requires information about many climatic elements – solar radiation, air masses, fronts, pressure systems, etc. (e.g., A.N. Strahler’s Classification based on Air Mass origin and interactions → 3 major groups + H: Low-, Mid- and High-latitude Climates + Undifferentiated Highlands); each group subdivided into climates with unique characteristics. Complex and difficult to create and use because of the multitude of variables and data needed → Not widely used.

2. Empirical Classification that are based on observable characteristics and/or statistical and mathematical parameters Most climate classification systems, including the Early Greek System (Torrid, Temperate, Frigid), and the Thornthwaite System, are examples of empirical classification

Thornthwaite classification system focuses on a local scale & is based on the concept of potential evapotranspiration  Climate types based on water requirements. Motivated by the desire to predict the supply and demand for water in different climate regions  Moisture Index Recognizes 5 global climatic zones based on potential ET (See Map below)

However, the most widely used climate classification was developed by the German botanist and climatologist Wladimir Koppen The Koppen Climate Classification: An empirical system Easy to use, and data requirements are minimal Based on observations of temperature and precipitation These are two basic climatic characteristics that can be readily measured, and probably the ones with the longest historical record Each climate is defined according to set values of mean monthly precipitation & mean monthly temperature , the grouping based on annual averages and seasonal extremes

Climate regions formulated to coincide with well-defined vegetation regions, and described by the natural vegetation most often found there The Simplified Köppen system, as modified by later climatologists, recognizes six major climatic types, each designated by a capital letter: A = Tropical Rainy Climates B = Arid (Dry) Climates C = Humid Mesothermal (Mild Winter) Climates D = Humid Microthermal (Severe Winter) Climates E = Polar Climates H = Highland Climates

The subtypes of the major categories are distinguished by a second (Upper or lower case) letter, and often a third (lower case) letter, giving us 14 to 23 sub-categories.

Modified Koppen Classification of World Climates

Note: (B) Arid (Dry) Climates Evaporation (Potential ET) exceeds precipitation BWh, BWk: Desert (Precipitation less than half the potential ET) BSh , BSk : Steppe (Precipitation more than half the potential ET)

Polar and highland climates

Highland Climates  Topoclimates  Vertical Zones of Microclimates and Vegetation

Urban Climates Urban heat island effect – cities often hotter than surrounding countryside Stone, concrete, and asphalt re-emit lots of solar energy Little surface water to transfer heat Thermal contribution from combustion Buildings block winds Air pollution absorbs heat to produce local greenhouse warming

The urban heat island effect

Warm air rising over a city creates a low-pressure zone. As a result, precipitation is greater in the city than over the surrounding countryside.

Factors Influencing the World Climatic Regions Climate patterns show the close relationships among the elements and factors of weather and climate: 1) Latitude and its influence on solar radiation received 2) Air mass influences 3) Location of global high and low pressure zones/belts 4) Pattern of prevailing winds (wind belts) 5) Location of mou ntain barriers 6) Heat exchange from ocean currents 7) Distribution of land and water 8) Altitude or elevation 9) Human Activities – Destruction of forests, creation of reservoirs, urbanization – Urban Heat Islands At a macro level, the first three factors are most important in influencing a region's climate.

Diversity of Climates within Proximate Areas – Influence of Geography?

Relationship between Climate and natural vegetation Vegetation is the most visible expression of climate

Classification of Global Natural Vegetation

HOW DOES CLIMATE INFLUENCE OTHER ASPECTS OF THE ENVIRONMENT? Animal life adapts to both climate and vegetation Soils develop in response to climate and vegetation Landforms are constantly modified by climate-related processes Water availability is related to humid vs. arid climates HOW DOES CLIMATE RELATE TO ECOSYSTEMS? The interaction of climate, vegetation, animal life, soils, and landforms creates an environmental complex or ecosystem Unique ecosystems evolve primarily as a result of differing climate conditions

WHAT IS THE IMPACT OF CLIMATE UPON PEOPLE'S LIVES? Regions of extreme climatic conditions have fewer people -- Deserts, rainforests, polar regions Climate influences agriculture -- Choice of crops grown and animals raised Tourism and recreation patterns are shaped by climatic conditions Water resources availability and utilization also affected by climate Climate and disease – relationships have persisted despite technological advancement Climatologists and geographers study and compare climate regions that have evolved in response to different moisture and temperature conditions, in order to enhance our understanding of these and other relationships.