/
The Role of Isostasy in the Evolution and Architecture of Fold and Thrust Belts The Role of Isostasy in the Evolution and Architecture of Fold and Thrust Belts

The Role of Isostasy in the Evolution and Architecture of Fold and Thrust Belts - PowerPoint Presentation

luna
luna . @luna
Follow
67 views
Uploaded On 2023-10-04

The Role of Isostasy in the Evolution and Architecture of Fold and Thrust Belts - PPT Presentation

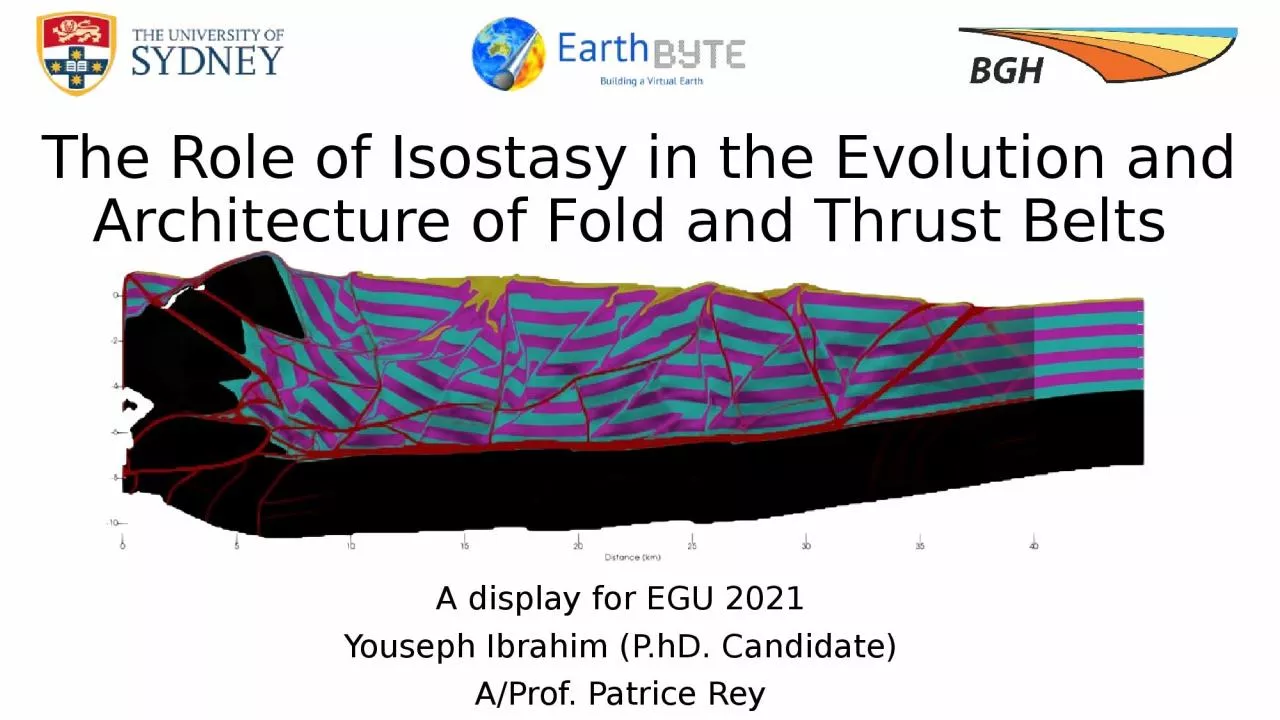
A display for EGU 2021 Youseph Ibrahim PhD Candidate AProf Patrice Rey Rate of Tectonic Loading vs Rate of Isostasy Horizontal Tectonic Forces Vertical Isostatic Flexure Vs Convergence velocities are generally within a few cm ID: 1022433

tectonic rate isostatic thrust rate tectonic thrust isostatic fold belts subandean subsidence case numerical isostasy study elastic rates experiments

Share:

Link:

Embed:

Download Presentation from below link

Download Presentation The PPT/PDF document "The Role of Isostasy in the Evolution an..." is the property of its rightful owner. Permission is granted to download and print the materials on this web site for personal, non-commercial use only, and to display it on your personal computer provided you do not modify the materials and that you retain all copyright notices contained in the materials. By downloading content from our website, you accept the terms of this agreement.


Presentation Transcript

1. The Role of Isostasy in the Evolution and Architecture of Fold and Thrust Belts A display for EGU 2021Youseph Ibrahim (P.hD. Candidate)A/Prof. Patrice Rey

2. Rate of Tectonic Loading vs Rate of IsostasyHorizontal Tectonic ForcesVertical Isostatic FlexureVs.Convergence velocities are generally within a few cm/yrIsostatic rates constrained by post-glacial uplift vary from 5 mm/yr to as high as 41 mm/yrDuring the accretion of a fold and thrust belt, a load is imposed on the underlying crust and mantle as thrust sheets are stacked.Here we explore competing tectonic and isostatic rates in the context of fold and thrust belts:

3. Tectonic RateIsostatic Rate>Tectonic RateIsostatic Rate<Tectonic RateIsostatic Rate≈We run a set of numerical experiments exploring scenarios where:In this scenario, loading of thrust sheet occurs faster than the rate at which subsidence occursIn this scenario, subsidence occurs simultaneously with the stacking of thrust sheetsWe present two intermediate examples between the two end-member scenarios above

4. A Numerical Modeling Approach2-D numerical modelling using the Underworld Framework80 meter resolutionMaterials are elasto-visco-plasticSurface processes through mechanical erosion and hillsope diffusion lawIsostasy implemented through proxy by a virtual basal layer and a basal boundary condition

5. How we implement ‘pseudo-isostasy’Pressure is held constant at the base of the modelBasal Velocity boundary condition is updated each timestepThe amount of flexure needed scales with the density of the basal layerNormally, you would need to include the asthenosphere in a numerical model to capture isostasy, though to model at the scale needed for high-resolution fold and thrust belts, we needed a work-around:

6. Tectonic Rate > Isostatic RateTectonic Rate < Isostatic Rate2 cm/yr10,000 kg m31 cm/yr6,000 kg m31 cm/yr4,000 kg m30.5 cm/yr3,200 kg m3Experiment Animations (mp4 videos)10 km shortening

7. ResultsWhen the rate of isostatic adjustment is larger than the tectonic rate, thin-skinned fold and thrust belts were narrower, less elevated, and their internal architecture were more complex, relative to the opposite situation where tectonic rates are dominant.

8. Fold and thrust belts profilesIn the experiments where tectonic rate was greater than the isostatic rate, fold belts stood taller and wider than the opposite scenario, with the same amount of shortening

9. Lithospheric elastic thickness ranges from 10 km at latitude 25°S, to 90 km at latitude 20°S (Watts et al., 1995; García et al., 2018)There is a change in structural style that correlates with the change in lithospheric elastic thicknessThis region is ideal to assess how the strength of a plate (its elastic thickness) impacts on the development of FTBs. A case study from the Subandean zoneTo move past the complexities that arise when comparing fold belts from different parts of the world, we compare different parts of a fold and thrust belt that evolved as part of the same system. The Subandean zone is an ideal area for a case study because:

10. A case study from the Subandean zoneNorthern Subandean zone, where Te is low, similar to experiment I>T where isostatic rate is compatible with the tectonic rate, so subsidence occurs as thrust sheets stack.

11. A case study from the Subandean zoneSouthern Subandean zone, where Te is high, similar to experiment T>I where the tectonic rate exceeds the rate at which isostasy operates

12. ConclusionOur experiments suggest that the structural architecture of a fold and thrust belt is sensitive to the interplay between isostasy and tectonicsWhen the isostatic rate was synchronous with the tectonic rate, the outward propagation of FTBs towards the foreland is impeded, leading to the localization and accumulation of shortening in a narrow region which becomes structurally more complex. Importantly, it also impedes the development of higher topography.When the tectonic rate exceeds the isostatic rate, FTBs propagate farther outwards through structural repetitions. The smaller isostatic subsidence leads to higher topography. Implications for sediment flux, as higher topographies will lead to increased erosion and sedimentation in the adjacent drainage basin.

13. Questions, Comments, Concerns, or Discussion?Write me at yibr0590@uni.sydney.edu.au