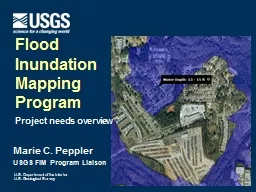
/
Marie C. Peppler  USGS FIM Program Liaison Marie C. Peppler  USGS FIM Program Liaison

Marie C. Peppler USGS FIM Program Liaison - PowerPoint Presentation

mentegor
mentegor . @mentegor
Follow
343 views
Uploaded On 2020-08-03

Marie C. Peppler USGS FIM Program Liaison - PPT Presentation

Flood Inundation Mapping Program Project needs overview Flood Inundation Maps translate a hydrograph into operational maps that communicate risk and consequences Over 8000 USGS Gages reporting current stream conditions in ID: 795883

data flood maps usgs flood data usgs maps inundation water modeled model gov creation conditions hydraulic fim http forecast

Share:

Link:

Embed:

Download Presentation from below link

Download The PPT/PDF document "Marie C. Peppler USGS FIM Program Liais..." is the property of its rightful owner. Permission is granted to download and print the materials on this web site for personal, non-commercial use only, and to display it on your personal computer provided you do not modify the materials and that you retain all copyright notices contained in the materials. By downloading content from our website, you accept the terms of this agreement.


Presentation Transcript

Slide1

Marie C. Peppler USGS FIM Program Liaison

Flood

Inundation

MappingProgram

Project needs overview

Slide2

Flood Inundation Maps translate

a hydrograph

into operational maps that communicate risk and consequences

Slide3

Over

8,000

USGS Gages reporting current stream conditions in

NWIS

Over 4,000 NWS Flood Forecast/Warning locations in AHPS

USGS and NWS Data Networks

The FIM Program is built upon these existing

data and

all of the expertise that is required to develop and maintain them.

Slide4

Creation of Flood Inundation Maps

Choose Stream ReachStreamflow informationFlood Forecast informationElevation data availabilityTopographyBathymetryStructure Data AvailabilityFlood Impact LocationsCritical infrastructure

Routes of egressPopulation locations

Slide5

Gather Data

Real-time streamflow information from a gage within the selected reachHistorical flood levels at that gageCurrent and historical rating curves at that gageShort-term probabilistic forecasts at that gageHigh-resolution elevation data (dictates the quality of the maps more than any other factor)Existing hydraulic models (if available and recent)

Slide6

Creation of Flood Inundation Maps

Hydraulic ModelingCalibrate model to streamgage record and current land coverWell developed rating curves are crucialAny appropriate model is acceptedUSACE HEC-RAS is commonModel must be peer-reviewed and documented

Modeled flood scenarios are chosen to reflect local conditions (bridge conditions, levees, temporary structures, etc.)

In highly complex flow situations, a 2D model might be warranted

Slide7

Creation of Flood Inundation Maps

Geospatial ProcessingCreate TIN models using cross sections and the modeled water surface profileIntersect the TIN with the DEM to generate predicted inundated areas depth gridsClean up and QA data

Repeat for all modeled water surface profiles to generate a library of maps

Slide8

Peer-Reviewed Documentation

Required:Uncertainty and Use LimitationsStudy area and scopeHydrologic dataHydraulic model calibration and performanceAccuracy assessmentMetadataRecommended:

Technical Summary Notebook of the hydraulic modelProject QA/QC checklist completed by the project teamPublished to a public website

http://water.usgs.gov/osw/flood_inundation/toolbox/librarytools.html

Slide9

FIM Mapper – more than just maps

http://wim.usgs.gov/FIMI/

+

+

USGS

Real-time streamgage

NWS Flood Forecast

Flood Library

Turns the modeled map data into an operational tool by combining data together with tools that enhance the utility and don’t require any Modeling or GIS software or skills

Slide10

Questions

Marie C. PepplerUSGS Wisconsin Water Science Centermpeppler@usgs.gov

http://water.usgs.gov/osw/flood_inundation

/