/
Potential Predictability of Tropical Pacific Ocean Potential Predictability of Tropical Pacific Ocean

Potential Predictability of Tropical Pacific Ocean - PowerPoint Presentation

mercynaybor
mercynaybor . @mercynaybor
Follow
343 views
Uploaded On 2020-08-07

Potential Predictability of Tropical Pacific Ocean - PPT Presentation

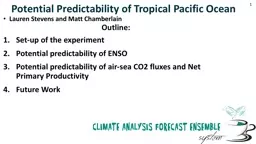
Lauren Stevens and Matt Chamberlain Outline Setup of the experiment Potential predictability of ENSO Potential predictability of airsea CO2 fluxes and Net Primary Productivity Future Work 1 ID: 801370

predictability forecasts potential climate forecasts predictability climate potential forecast months january lead nino3 correlation ensemble system persistence coefficient years

Share:

Link:

Embed:

Download Presentation from below link

Download The PPT/PDF document "Potential Predictability of Tropical Pac..." is the property of its rightful owner. Permission is granted to download and print the materials on this web site for personal, non-commercial use only, and to display it on your personal computer provided you do not modify the materials and that you retain all copyright notices contained in the materials. By downloading content from our website, you accept the terms of this agreement.


Presentation Transcript

Slide1

Potential Predictability of Tropical Pacific Ocean

Lauren Stevens and Matt ChamberlainOutline:Set-up of the experimentPotential predictability of ENSOPotential predictability of air-sea CO2 fluxes and Net Primary ProductivityFuture Work

1 |

1

Slide2

Coupled Model – MOM4 (

ACCESSo

grid and SIS) with AM2 (v1 control with 500 years of simulations)

Forecasts from January 1

st

going for 6 years with 10 ensemble members

First set is from years 315 – 319 (5 years)Small random SST perturbation in the tropicsSecond set is from years 305, 315, 320, 335, 350, 365,…,440 (11 years)Small random SST perturbation at one point in the tropics

Forecasts

2

Slide3

NINO3.4 Variability

3

15 January forecasts

Example Forecast

Slide4

NINO3.4 Variability

4

15 January forecasts

Example Forecast

Slide5

Year 305 – Red Observed; Black and grey forecast

Potential Predictability: NINO3.4

5

11 January forecasts

Example Forecast

Slide6

Potential Predictability: NINO3.4

6

11 January forecasts

Slide7

Potential Predictability: Tropical Pacific

7

Seferian

et al., 2013, PNAS

1 year lead

2-5 year lead

Slide8

Potential Predictability: CO2 Flux

8

12-month lead: Correlation Coefficient

forecasts

Persistence

Slide9

Potential Predictability: CO2 Flux

9

24-month lead: Correlation Coefficient

forecasts

Persistence

Slide10

Potential Predictability: Net Primary Productivity

10

12-month lead: Correlation Coefficient

forecasts

Persistence

Slide11

Potential Predictability: Net Primary Productivity

11

24-month lead: Correlation Coefficient

forecasts

Persistence

Slide12

Future work

Potential predictability experiments provide a convenient way to assess different forecasting strategiesEnsemble generation methodsImpact of different climate regimesNovel forecasting productsothers

12

12

Slide13

Potential Predictability: NINO3.4

13

11 January forecasts

Slide14

Potential Predictability: NINO3.4

14

11 January forecasts

Slide15

Potential Predictability: NINO3.4

15

11 January forecasts

Slide16

Potential Predictability: NINO3.4

16

11 January forecasts

Slide17

Potential Predictability: Soil Moisture

17

15 January forecasts

20-month lead: Correlation Coefficient

forecasts

Persistence

South Australia: (south of 33°S)

Anomaly Correlation Coefficient

Lead Time (months)

Blue- forecast

Orange - persistence

Slide18

Potential Predictability: NINO3.4

18

15 January forecasts

Example Forecast

Slide19

19

ENSO

Anomaly Correlation

Zheng 2010

v0

v1

Slide20

20

Nino4 Discrimination Plot:

v0

v1

3 months

6 months

9 months

Assess the ability to forecast an event (El Nino or La Nina) and no event

Not able to reliably forecast

an event

Slide21

21

Nino4 Discrimination Plot:

v1

v1

3 months

6 months

9 months

Not enough events

In the forecast

Slide22

CAFE System

Climate Model – MOM5 (SISE,WOMBAT) with AM2 ->MOM5 with AM3 and ACCESS-ESM 1Data Assimilation – EnOI with ocean observations ->EnKF (96 members) with ocean, sea ice and atmospheric dataEnsemble generation with Bred Vectors -> several different sets of BVs targeting different time-scales

Forecasts – new dataset of monthly forecasts to follow the couple DA development (6 months)

22

22

Slide23

https://jobs.csiro.au

Postdoctoral Fellowship Sea Ice Modeller (56719)Postdoctoral Fellowship - Climate regimes (56508)Postdoctoral Fellowship - Ocean-Atmosphere dynamics (56622)CSIRO Postdoctoral Fellowship – Atmospheric DynamicsCSIRO Postdoctoral Fellowship - Ocean-Atmosphere Carbon Fluxes (49441)

Post Doctorial Positions

23 |

23

Slide24

24

ROC:

4 months

6 months

9 months

v0

v1

Slide25

Potential Predictability: Rainfall

25

15 January forecasts

South Australia (south of 33°S):

Anomaly Correlation Coefficient

Blue- forecast

Orange - persistence

Lead Time (months)

20-month lead: Correlation Coefficient

forecasts

Persistence

Slide26

Forecasts:

DA vs Reanalysis

for initial state

26

January forecasts (2005

to 2016)

Slide27

Decadal Climate Forecasting Project

Initial GoalsBuild the Climate Analysis Forecast Ensemble (CAFE) system and deliver multi-year to decadal climate forecasts (probabilistic problem and we will provide ensemble forecasts) Apply diagnostics tools, including ensemble verification metrics, to accurately assess the skill of the forecastsAdvance fundamental research into: where does the predictability of the climate system resides, the processes that give rise to that predictability, and the key observations that help us to realise the potential climate predictability Explore the utility of our climate forecasts for a select group of external clients (e.g. Digiscape) 27 |

27

Slide28

Data Assimilation, Climate Modelling and Ensemble Generation

Develop and run a coupled ocean-atmosphere-sea ice climate model data assimilation scheme to incorporate observations into the climate model to characterise the climate stateEnsemble climate forecasting system initiated from the climate stateThis is the core of the Climate Analysis Forecast Ensemble (CAFE) system

28

Slide29

Processes and Observations

Climate Processes that drive potential predictabilityPredictability StudiesObserving System Experiments and Observing System Simulation Experiments New observation for data assimilation (e.g. sea ice, ocean colour) and assessment of their impact on the climate forecasts

29

Slide30

Application and Verification

• need process-based skill assessment• understand mechanisms underlying forecasts• outline deficient process representations in model • provide narrative for forecast use• document skill in public archives and over time• no magic Strong overlap with all components of CAFE System

30

Slide31

Forecast Dataset - 2002 -2016

every month of length 2 years with 11 ensemble membersevery 6 months of length 6 years with 11 ensemble membersTo apply a forecast need to understand what the forecast is need to know how to use it need to evaluate how good it isneed to understand its limitationsneed to support the close collaboration between the generation of the forecast and the users

31