/
THE HELIXTOCOIL TRANSITION IN DNA THE HELIXTOCOIL TRANSITION IN DNA

THE HELIXTOCOIL TRANSITION IN DNA - PDF document

mila-milly
mila-milly . @mila-milly
Follow
346 views
Uploaded On 2022-09-06

THE HELIXTOCOIL TRANSITION IN DNA - PPT Presentation

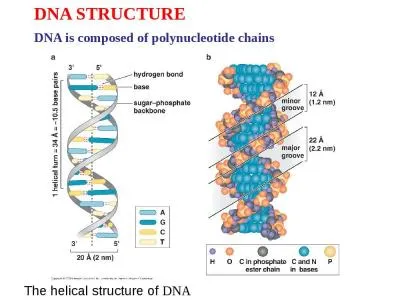
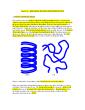
1 THE DNA DOUBLE HELIX the basic building template ontrolling the amino acid sequences that form the genes DNA is formed of backbone phos side group amine bases The charged phosphatesugar group ID: 950978

transition coil temperature dna coil transition dna temperature helix helical melting glycol absorption data ethylene 100 sans units phase

Share:

Link:

Embed:

Download Presentation from below link

Download Pdf The PPT/PDF document "THE HELIXTOCOIL TRANSITION IN DNA" is the property of its rightful owner. Permission is granted to download and print the materials on this web site for personal, non-commercial use only, and to display it on your personal computer provided you do not modify the materials and that you retain all copyright notices contained in the materials. By downloading content from our website, you accept the terms of this agreement.


Presentation Transcript

THE HELIX-TO-COIL TRANSITION IN DNA 1. THE DNA DOUBLE HELIX the basic building template ontrolling the amino acid sequences that form the genes. DNA is formed of backbone phos side group amine bases. The charged phosphatesugar groups are mostly hydrophobic, and the amine bases contain hydrophilic groups. DNA forms a helical structure of the amine bases and of the hydrogen bonding ps from contact with water. The helix phase melts into disordered coils under Figure 1: Schematic representation of the DNA helix and coil conformations DNA macromolecules form helicale form and melt to a random rm. The denaturation transition consists in a helix-to-coil transition that can be promoted either usi the simpler heating route is discussed using two characterization methods: the UV absorption spectroscopy and SANS. Helix Coil 2. UV ABSORPTION SPECTROSCOPY Ultra-violet (

UV) light absorption spectroscopy is sensitive to the stacking of groups such as the amine bases in DNA. It is an effective method to monitor the helix-to-coil transition. 0.51.52.5200220240260280300320UV Absorption Spectroscopy Measured UV AbsorbanceUV Wavelength (nm) spectrum from DNA showing a wavelength of 260 nm. The monitoring of the intensity at the peak position (260 nm) with increasing temperature red at the helix-to-coil transition temperature. The helix-to-coil transition is mediated the amine bases and the breaking of A sample containing 4 % salmon DNA (molecular weight of 1.3 *10 g/mol) in water is characterized by a helix-to-coil transition temperature of 94 C. Since this temperature is too close to the boiling temperature for water (100 erized by a more convenient helix-to-coil C. The characteristic sigmoid shape function was obtained in each c

ase. The inflection point corresponds to the helix-to-coil melting temperature. In order to avoid saturation of the UV absorbance, 50 m thin samples were measured. Since the same DNA samples were invesSANS, deuterated solvents were used with both characterization methods. Moreover a 100 mM NaCl salt content was added throughout DNA phosphate groups. 1.82.22.42.62.820304050607080901004 % DNA in d-ethylene glycol and in d-water, 100 mM NaCl 4% DNA/d-ethylene glycol 4% DNA/d-water260 nm Absorption Peak HeightTemperature (Transition Temperatures ties at 260 nm with increasing temperature for 4 % DNA in d-water 3. HELIX-TO-COIL TRANSITION IN MIXED SOLVENTS ffective way to monito ene glycol mixed solvents. The same 4 % salmon DNA weight fraction and 100 mM NaCl salt content were used. -0.200.20.40.60.811.24 % DNA in d-water/d-ethylene glycol mixtures, 100 mM NaCl Secon

d Temperature Transition Temperature First TemperatureTransition Temperatures (d-Ethylene Glycol FractionDNA/d-waterDNA/d-ethylene glycol helix-to-coil transition temperature for 4 % DNA in mixed d-water/d-ethylene glycol mixed solvents. The monotonic linear variation is attributed to from the helix side whereby solvents mix randomly (ideal solvent mixing behavior). The fact that the melting temperature decreases wi in d-ethylene glycol play an important role in the melting transition. They help solvent molecules cross the hydrophobic zone of the e helical structure. This argument helps understand the micellar nature of the DNA macromolecules in terms of a hydrophobic sugar region and hydrophilic phosphate and amine Figure 5: Simple representation of a cross section of the DNA macromolecule. RANSITION BY SANS The SANS technique is effective at determining macromo

lecular structures. A series of measurements were performed from a 4 % at temperatures ranging from 10 C to 80 SANS spectrum at two temperatures; one below (25 the helix-to-coil transition temperature. This temperature is known to be 38 US absorption measurements (Hammouda-Worcester, 2006). PHOSPHATESAMINE BASES 0.10.010.14 % DNA in d-ethylene glycol, 100 mM NaCl 25 50 Scattering Intensity (cmScattering Variable Q (ŠFigure 6: SANS from a 4 % mass fraction 100 mM NaCl sample measured at temperatures below (25 C) the helix-to-coil melting temperature. the two cases. The data show an abrupt phase but a gradual decrease for the coil phase. The SANS data were fit to the following empirical functional form that reproduces the main data features: . (1) The term A/Q represents the low-Q clustering (network) scattering part and the term (ξ)m] represents the hig

h-Q solvation part. B represents a Q-independent (mostly ents scattering from a large gel network structure. It does not change much across the melting transition. Our focus here is on the A figure shows the variation of the “solvation intensity” (the fitted quantity C) for increasing temperature. The intensity drop between 25 helix melting transition. Lowering temperature shows that this transition is weakly reversible with substantial hysteresis. Further temperature increase beyond the melting transition increases the solvation intensity. This result is typical of water-soluble polymers which are characterized by a Lower Critical Solution Temperature (LCST). 0.1350.140.1450.150.1550.160.1650.170204060804 % DNA in d-ethylene glycol, 100 mM NaClSolvation Intensity (cmTemperature (helixtransition Figure 7: Variation of the SANS solvation intensity (the quantity C i

n the empirical model) for increasing temperature. For temperatures beyond the melting transition, the solvation intensity increases. The correlation length also varies across the melting transition. This correlation length represents a weighted-average inter-distance between the hydramine base) groups. It is around 8.5 Å in the coil phase. In the helix phase the sugar-amine coil phase. This increase in tight helical structure into a correlation length is not a measure of the DNA radius. Raising the temperature further in the coil phase increases the correlation length even further; this is a familiar trend for LCST systems. 0204060804% DNA in d-ethylene glycol, 100 mM NaClCorrelation Length (Å)Temperature (helixcoiltransition in the empirical model) for increasing temperature. After melting, DNA coils swell with further temperature increase. Finally the high

-Q Porod exponent m is seen to vary between values around 3.7 in the helix phase to values close to 1.7 in the coil phase. DNA helices are appearing like cylinders with fairly smooth surfaces (Porod like polymer chains in good solvent conditions or in a fully swollen chain configuration 0204060804 % DNA in d-ethylene glycol, 100 mM NaClPorod Exponent Temperature (helixcoiltransition xponent m for increasing temperature. This exponent varies from 3.7 (cylinder) to 1.7 (swollen coil). rod-like nature of DNA (Porod edue to the clustering signal overwhelming the low-Q scattering. It is also noted that once the melting transition has taken place, DNA cosynthetic polymer chains. 5. A HELIX-TO-COIL TRANSITION MODELls have been published by many authors including Zimm (Zimm, 1959). The formulation from Flory’s book (Flory, 1969) will be followed closely Consider a macromo

lecule consisting of N units (think residues) comprising helical sequences. There is a total of N coil units. Define the partition function for the melting of one helical unit as s = exp( is the enthalpy needed, R is the molar gas constant (related to the Boltzman constant kthrough Avogadro’s number N) and T is the temperature in absolute units. Assume that it takes no enthalpy to form a coil so that the partition function for a coil unit is equal to 1. Define the partit lix-to-coil melting process is: Z = . (2) is taken over all helical units N and all helical sequences summation arrangements to form the macromolecule with N units). Figure 10: Schematic representation The partition function can be expressed in matrix notation as: Z = J* U J. (3) With: J* = U = J = . (4) J* means that the macromolecule starts with a coil unit and J means that

it finishes with either a coil or a helical unit. In order to perform the U product, the configuration matrix helical sequence coil sequence helical unit U is diagonalized into the form U=A is a diagonal matrix. U simplifies as . The eigenvalues and (diagonal elements of matrix 1 = 2s4)s1()s1(22 = . (5) The partition function can then be summed up to become: Z = )()1(2121 + . (6) The fraction of units in the helical state is given by: = N1 . (7) The fraction of units in the coil state is p. In the case of long macromolecules simplifies to: = )sln()ln(1 = . (8) The relative number of helic = )ln()ln(1 = . (9) The average number of helical = ppH = . (10) In the notation used here, the tota and the number of helical sequences is The meaning of the various parameters is discussed here. First what is the meaning of paramete

r s? The helix-to-coil transition is e sample, i.e., by the enthalpy needed to melt one unit . From the definition of s, one can express the deviation from the melting temperature T –T = (s-1). (11) This simple relation is obtained by expanding the exponential in the definition of s. The dimensionless variable s can be used instead of T. How to understand the meaning of parameter ? Note that at s = 1 (middle of the helix-to-coil melting transition corresponding to temperature T) the preceding results simplify to: , p , y . (12) Right at the transition point (i.e., at T = T /2 represents the number of helical sequences. One can think of as a helical sequence “nucleation” parameter. The helix-rough either a few or many helix-to-coil sequences (think “nucleation centers”) depending on the temperature conditions. This transition is similar to the melting transi

tion of crystalline materials that happens through nucleation centers. Note that this simple model applies to the simplest form of helix-to-coil transition macromolecules. This would on matrices U with different enthalpies for se stacking for AT or GC pairs). The results described here are approximate but sti EL TO UV ABSORPTION DATA transition UV absorption data obtained for 4 % DNA/100 mM pply the simple model described above, two rescalings of the UV data have are performed: (1) modification of the horizontal temperature axis into the variable s axis using the relationship betwscaling of the UV data vertical axis to a variation between 0 and 1. Moreover the values R = 1.989 cal/moldescribed here is not sensitive enough to let both float. The melting temperature (T= T melting = -6 kcal/mole. The data are plotted along with model best fit for the predicted psimple model

reproduces the sigmoid shape of the UV absorption data well. 0.20.40.60.80.20.40.60.811.21.41.6 rescaled UV absorption data model prediction for =0.0037UV Absorption Data and =1-p model predictionss variable Figure 11: The UV absorption data across the helix-to-coil transition is compared to with the best fit parameter = -6 kcal/mole The relative number of helical sequences p increases, reaches a maximum at s=1 (or ) then decreases. Note that at the melting transition (i.e., for T=T = 0.029 which means that there are 29 helical sequences per 1000 base units. REFERENCES B.H. Zimm, and J.K. Bragg, “Theory of thCoil in Polypeptide Chains”, J. Chem. Phys. 31 Look up mostly Chapter VII. B. Hammouda and D.L. Worcester, “The Denaturation Transition of DNA in Mixed Solvents”, Biophysical Journal 91 , 2237-2242 (2006). QUESTIONS 1. DNA is formed of what units? 2. What driv

es the formation of the helical structure of DNA? 3. What is the analytical measurement method of choice for observing the helix-to-coil transition? 4. What is the typical helix-to-coil transition temperaturDNA/ethylene glycol? 5. What is the SANS Porod exponent for the structure? What do these exponents mean? 6. What is the activation enthalpy for the melting of a helical unit? ANSWERS 1. DNA is formed of nucleotides. 2. The helical structure of DNA is driven by the stacking of the amine bases and the hydrogen-bonding between them. ytical measurement method of choice for coil transition. transition temperature of 94 temperature is around 38 5. A SANS Porod exponent close to 4 characte coil structure. A Porod exponent of 4 is for a cylinder with smooth surface whereas an exponent of 6. The melting of a helical unit is characterized by an activation enthalpy of -6