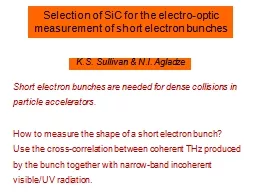
/
Selection of SiC for the electro-optic measurement of short electron bunches Selection of SiC for the electro-optic measurement of short electron bunches

Selection of SiC for the electro-optic measurement of short electron bunches - PowerPoint Presentation

min-jolicoeur
min-jolicoeur . @min-jolicoeur
Follow
349 views
Uploaded On 2018-11-13

Selection of SiC for the electro-optic measurement of short electron bunches - PPT Presentation

KS Sullivan amp NI Agladze Short electron bunches are needed for dense collisions in particle accelerators How to measure the shape of a short electron bunch Use the crosscorrelation between coherent THz produced by the bunch together with narrowband incoherent visibleUV radiation ID: 728895

optic electro frequency sic electro optic sic frequency znte coefficient thz transmission velocity group http response correlation material cross

Share:

Link:

Embed:

Download Presentation from below link

Download Presentation The PPT/PDF document "Selection of SiC for the electro-optic m..." is the property of its rightful owner. Permission is granted to download and print the materials on this web site for personal, non-commercial use only, and to display it on your personal computer provided you do not modify the materials and that you retain all copyright notices contained in the materials. By downloading content from our website, you accept the terms of this agreement.


Presentation Transcript

Slide1

Selection of SiC for the electro-optic measurement of short electron bunches

K.S. Sullivan & N.I. Agladze

Short electron bunches are needed for dense collisions in particle accelerators.

How to measure the shape of a short electron bunch?

Use the cross-correlation between coherent THz produced by the bunch together with narrow-band incoherent visible/UV radiation.Slide2

Electro-optic crystals

http://dev.fiber-sensors.com/wp-content/uploads/2010/08/electro-optic_example-01.png

Material-specific properties

Electro-optic effect on polarized lightSlide3

Single shot capability

Resolution determined by the EO crystal dispersion

Cross-correlation of coherent and incoherent radiation in EO medium

THz coherent pulse

Incoherent pulse

Cross-correlation

Non-collinear propagation enables a delay dependence

Advantages

CRYSTAL

DETECTORSlide4

Cross-correlation: principle experiment

SourceSlide5

Zinc Telluride (ZnTe)

High electro-optic coefficient

Useful frequency range limited by low vibrational mode (190 cm

-1

compared to GaP’s 366 or SiC’s 794)

Dispersion due to TO resonance

http://refractiveindex.info/figures/figures_RI/n_CRYSTALS_ZnTe_HO.pngSlide6

Silicon Carbide (SiC)

Comparable electro-optic coefficient to ZnTe

Higher TO resonance permits larger frequency rangeSlide7

Polytype Choice

http://japantechniche.com/wp-content/uploads/2009/12/sdk-sic-mosfet.jpg

Cubic SiC

Hexagonal SiC

Pure

Expensive

Subject to free carriers

Readily availableSlide8

6H Considerations

Free carriers or doping

Metallic behavior

Electro-optic coefficient’s angular dependence

http://metallurgyfordummies.com/wp-content/uploads/2011/04/doping-semiconductor.jpgSlide9

6H Transmission

Increase in transmission toward Brewster angle

Lacks metallic free carriers

Unexpected feature at ~110 wavenumbersSlide10

6H Absorption Coefficient

Use transmission relation to plot absorption coefficient,

α

Ideally zero

Notable frequency dependence

Unknown feature possibly due to fold-back or material defectsSlide11

Focus on 3C

Unlike 6H, 3C does not require calculation of an angle to maximize the electro-optic coefficient

Cubic/Zinc-blende structure similar to ZnTe and GaP

Necessary to calculate electro-optic response

http://upload.wikimedia.org/wikipedia/commons/4/4f/SiC3Cstructure.jpgSlide12

Electro-optic Response

Transmission coefficient based on refractive index

Integral uses frequency, thickness, phase velocity of THz radiation, and group velocity at optical frequency

Shape of resulting function comes primarily from the mismatch between phase and group velocitySlide13

Dielectric Model

Because of the electro-optic response function’s reliance on

phase and group velocities, we need a model of the dielectric function from the UV to the THz.Slide14

Comparative Responses

GaP shown at optical group velocity at 8352 cm

-1

ZnTe at 12500 cm

-1

SiC at 37495 cm

-1

Cut-off frequency set at 4 THzSlide15

Electro-optic Performance

Previous approach masks full electro-optic properties

Transmission, crystal thickness, and electro-optic coefficient all important

Figure of merit proportional to the polarization rotation produced by the THz field

r (10

-12

m/V)

d (microns)

Figure of merit (r

×

d)

GaP

1

1800

1800

ZnTe

4

185

740

SiC

2.7

4950

13365Slide16

Alternate Comparison

Material group velocity maintained by choosing the optimal visible/UV frequency

Figure of merit held at 500 for each material

Note SiC covers a larger rangeSlide17

Results and Further Research

6H unsuited for measurement of bunch length

3C seems promising due to a larger broad-band capability than both ZnTe and GaP

Idealized electro-optic response analysis of SiC shows significant improvement over similar crystals at optimal optical frequenciesSlide18

Acknowledgements

Al Sievers and Nick Agladze

CLASSE

National Science Foundation