PPT-Temporal, Geographic and Demographic Trends of Early Onset
Author : mitsue-stanley | Published Date : 2017-04-27
Holly S Mason MD FACS Jane Garb MS Early Onset Breast Cancer Breast CA is leading cause of cancer in women Second cause of cancerrelated deaths Leading cause of
Presentation Embed Code
Download Presentation
Download Presentation The PPT/PDF document "Temporal, Geographic and Demographic Tre..." is the property of its rightful owner. Permission is granted to download and print the materials on this website for personal, non-commercial use only, and to display it on your personal computer provided you do not modify the materials and that you retain all copyright notices contained in the materials. By downloading content from our website, you accept the terms of this agreement.
Temporal, Geographic and Demographic Trends of Early Onset: Transcript
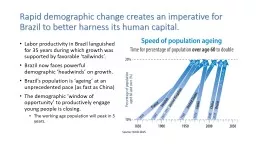
Holly S Mason MD FACS Jane Garb MS Early Onset Breast Cancer Breast CA is leading cause of cancer in women Second cause of cancerrelated deaths Leading cause of death in women under 40 Stage at presentation is more advanced. LT: Students will begin to understand the concept of geographic luck by exploring the story of crops and animals around the world. . What is . “Geographic Luck”?. Developed by . Jared . Diamond. Tries to answer the question: W. I can use a capital letter for the beginning of holidays, product names, and geographic names.. What is a holiday?. What are geographic names?. What is a product?. How do you know which words need a capital letter?. A . case for . Adult Cautioning. Carleen Thompson. Anna Stewart. Troy Allard. April . Chrzanowksi. Funded by a Criminology Research Council Grant. Why Adult-Onset Offending?. 30-40% . of offenders (!!). OT 122. Chapter Six. Introduction. Geographic Filing. Records are sorted by location. Geographic Filing Procedures. Step One – Inspecting. Release mark!. Step Two – Indexing. Look for correspondent’s location 1st. UNITED STATES BOARD ON GEOGRAPHIC NAMES Department of Agriculture Sterling J. Wilcox, member Department of Commerce Joel L. Morrison, member Department of Defense Larry N. Muncy, mem DEMOGRAPHIC RESEARCH http://www.demographic-research.org/Volumes/Vol26/11/ DOI: 10.4054/DemRes.2012.26.11centenarians explained Level 2 Classroom. 2017 Mock Challenge. [INSERT SCHOOL NAME]. Format and Instructions. Canadian Geographic Challenge. Format and Instructions. There are 50 multiple choice questions, divided into 7 rounds. . . 2 CFR 200.319(b). Geographical . Preferences . Map used with permission from Oregon Agriculture in the Classroom Foundation . www.oregonaitc.org. Ways to define local: . Miles. County. State. Region. Chris Paris, . FAcSS. , Emeritus Professor of Housing, Ulster University. Joe Frey, Head of Research, Northern Ireland Housing Executive. Introduction & overview. Theoretical focus: . demographic . Labor productivity in many LAC countries has languished for years during which growth was supported by favorable ‘tailwinds’. . Countries now faces powerful demographic ‘headwinds’ on growth. . Strategy Update. Lori Petre. January 31, 2018. Demographic Data (DUG) . – Background . Since 7/1/16 . AHCCCS has . solicited . stakeholder. . feedback in a variety of ways regarding provider reporting of Demographic and Outcome Data Set (commonly known as the DUG) . Establishing differences and learning from them International Partnership and Mobility Award. Ludi Simpson (Manchester) and Brenda Yepez (Caracas) with the Population Association of Latin America (ALAP). Bakary Dosso, Chief of section. Sub-regional office for West Africa (SRO-WA). 2020 Second Quarter Accountability and . Programme. Performance Review Meeting. 8 – 10 July 2020. [Virtual]. Map. - West . Methods and Results. Olanrewaju Olaniyan, . Akanni. . Lawanson. , Noah Olasehinde, . Olabanji. . Awodumi. , . Oyeteju. . Odufuwa. , Temitope . Faronbi. , and . Andat. . Dasogot. Presented on 15 February 2023 during the 14th Global Meeting of...
Download Document
Here is the link to download the presentation.
"Temporal, Geographic and Demographic Trends of Early Onset"The content belongs to its owner. You may download and print it for personal use, without modification, and keep all copyright notices. By downloading, you agree to these terms.
Related Documents