/
The Influence of Solar Variability on the Atmosphere and Oc The Influence of Solar Variability on the Atmosphere and Oc

The Influence of Solar Variability on the Atmosphere and Oc - PowerPoint Presentation

mitsue-stanley
mitsue-stanley . @mitsue-stanley
Follow
387 views
Uploaded On 2016-05-25

The Influence of Solar Variability on the Atmosphere and Oc - PPT Presentation

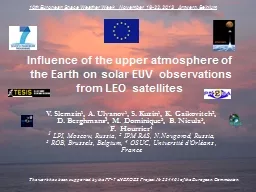
Speaker PeiYu Chueh Adviser YuHeng Tseng Date 20100916 Review Observation Solar variability The amplitude of the solar cycle is relatively small about 02 Wm 2 ID: 334293

forcing solar ozone review solar forcing review ozone influence 2005 response model haigh 1999 observed cycle van loon ocean

Share:

Link:

Embed:

Download Presentation from below link

Download Presentation The PPT/PDF document "The Influence of Solar Variability on th..." is the property of its rightful owner. Permission is granted to download and print the materials on this web site for personal, non-commercial use only, and to display it on your personal computer provided you do not modify the materials and that you retain all copyright notices contained in the materials. By downloading content from our website, you accept the terms of this agreement.


Presentation Transcript

Slide1

The Influence of Solar Variability on the Atmosphere and Ocean Dynamics

Speaker:Pei-Yu Chueh Adviser:Yu-Heng TsengDate:2010/09/16Slide2

ReviewSlide3

Observation-Solar variability

The amplitude of the solar cycle is relatively small, about 0.2 Wm−2 globally averaged

(Lean 2005), and the observed global SST response of about 0.1°C would require more than

0.5 Wm

−2

(White 1998), there has always been a question regarding how this small solar signal could be amplified to produce a measurable response.Slide4

Observation-Solar signals

[van Loon et al., 2000]

bathythermograph

[White et al., 1997]

Atmosphere

OceanSlide5

Review-The influence of solar forcing Small-amplitude variations in solar radiation that occur during the approximately 11-yr solar cycle [the decadal solar oscillation (DSO)] may produce significant responses in the

troposphere and ocean. Specifically for the Indo-Pacific region.[Haigh 1996, 2001, 2003; Lean and Rind 2001; Rind 2002; Lean et al. 2005; van Loon and Labitzke 1998; van Loon and Shea 1999, 2000; Gleisner and Thejll 2003; van Loon et al. 2004; Crooks and Gray 2005; Wang et al. 2005; Bhattacharyya and Narasimha 2005; Lim et al. 2006; White et al. 1997, 1998; Bond et al. 2001; Weng 2005]Slide6

Review-The influence of solar forcing

[Meehl, 2008]Slide7

Review-The influence of solar forcingsolar induced percentage ozone changes between solar max and min

[Haigh, 1994]Annual Mean (%)

Solar maximum → more UV radiation

→ more ozoneSlide8

Review-The influence of solar forcing

[Crooks and Gray, 2005]

ERA40 (1979-2001)

+1.75K

+0.5KSlide9

Review-The influence of solar forcing

[Kodera and Kuroda, 2002; Matthes et al. ,2004, 2006]Slide10

Review-Mechanism

Increased solar increased ozone heating/Increased ozone amount modified temperature and zonal windaltered wave propagation changed equator to pole energy transport and circulation enhanced tropical precipitation

[Haigh, 1996; Shindell et al., 1999;

Balachandran et al., 1999

]

The top-down stratospheric ozone mechanismSlide11

Review-Mechanism[Meehl et al., 2003; Van Loon et al., 2007]

The bottom-up coupled air-sea mechanism

Increased solar over cloud-free regions of the subtropics translates into greater evaporation, and moisture convergence and precipitation in the ITCZ and SPCZ (and south Asian monsoon), stronger trades, and cooler SSTs in eastern equatorial Pacific.

N

SSlide12

Could the two mechanisms add together to boost the climate response to solar forcing?

ObservedBottom-up onlyTop-down only

Both bottom-up and top-down

[Meehl et al., 2009; Rind

et al., 2008

] Slide13

MotivationThe quasi-decadal oscillation (QDO) near 11-year period was one of the principal signals observed in global patterns of sea surface temperature (SST) and sea level pressure (SLP) during the 20th century.

Observations have shown that the 11-year cycle of solar forcing may have some influence on climate system, in both the atmosphere and ocean.However, the amplitude of solar cycle is relatively small, about 0.2 Wm-2. Therefore, we are interested in how these small variations affect our climate system.If solar cycle is important, we could add this forcing in our models in the future to reproduce the observed signals more accurate. Slide14

ObjectivesSlide15

COSMOS = Community Earth system modeling systemSlide16

Review-The influence of solar forcingIn the atmosphere

The Aleutian low moved westward and the Pacific subtropical high moved northward during solar maxima for the period 1900–94.[Christoforou and Hameed 1997]Variations in UV and solar-induced changes in ozone may have an effect on radiative forcing but additionally may affect climate through a dynamical response to solar heating of the lower stratosphere. [Haigh 2002]

Solar did have impact on both the tropospheric and stratospheric meridional circulations.

[Matthes et al. 2004, 2006]Slide17

Review-The influence of solar forcingIn the ocean

There is a cold event–like pattern during decadal periods of high solar forcing. [Mann et al. 2005]The decadal solar oscillation at its peaks strengthens the major convergence zones in the tropical Pacific during northern winter. [van Loon et al. 2007] Precipitation changes have also been reported, in particular increased precipitation in July and August in the tropical western Pacific, and the various monsoon regions: South Asian, west African, and North America.

[Kodera, 2004; van Loon et al., 2004, 2007; Bhattacharya and Narasimha, 2005; Kodera and Shibata, 2006]Slide18

Review-ModelCubasch et al . (1997) suggested a possible solar contribution to the mid-20th century warming and a solar contribution of 40% of the observed global warming over the last 30 years.

Stott et al .(2002), suggests that the GCM simulations may underestimate solar influence by up to a factor of three. One potential factor is the spectral composition of the solar irradiance variations and the resultant modulation of stratospheric ozone (Haigh 1994). Models in general are unable to simulate the necessary stratospheric ozone response, as they produce maximum ozone change in the mid stratosphere, instead of in the upper and lower stratosphere as observed. [e.g., Shindell et al., 1999; Tourpali et al., 2003; Egorova et al., 2004; Sekiyama et al., 2006]Slide19

Review-Model

Haigh (1999) use a general-circulation model (GCM) to investigate the impact of the 11-year solar-activity cycle on the climate of the lower atmosphere. Solar forcing is represented by changes in both incident irradiance and stratospheric ozone concentrations. The GCM results suggest that the precise response of the atmosphere depends on the magnitude and distribution of the ozone changes.

As the latitude-height structure of solar-induced ozone changes over the 11-year cycle are not yet well established, the general circulation models are able to produce some of the observed patterns of response to solar activity but generally underestimate the magnitude

. [

Haigh

2002]Slide20

Review-ModelLee(2009)

use the Goddard Institute for Space Studies (GISS) Model to investigate tropical circulation.The model includes fully interactive atmospheric chemistry. The model experiments conditions: a doubly amplified solar forcing and the present-day and preindustrial greenhouse gases and aerosol conditions, with the mixed layer or fully coupled dynamic ocean model.With present-day greenhouse gas and aerosol conditions, the ascending branch of the Hadley cell is enhanced near the equator, and the ITCZ is shifted

northward in response to solar forcing during the boreal winter.

Enhancement of the

meridionally

averaged

vertical velocity

over the western Pacific indicates

strengthening of the Walker circulation

in response to solar forcing in both solstice seasons. Slide21

Thank you!Slide22

Review-Mechanism

The variations in stratospheric ozone in response to solar variability. Solar irradiance UV O3 StratosphereTroposphere warmingHeating ocean

[Haigh, 1996; Shindell et al., 1999; Balachandran et al., 1999]Slide23

Review-The influence of solar forcing

[Courtesy of Bill Randel, 2005]

SSU/MSU4 (1979-2003)

+0.9K