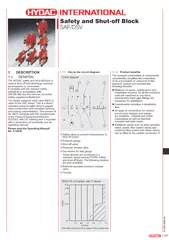
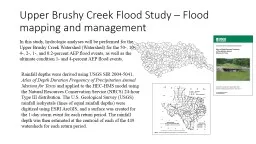
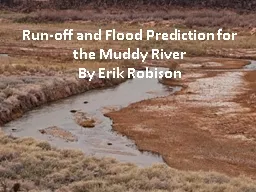
/
Run-off and Flood Prediction for the Muddy Run-off and Flood Prediction for the Muddy

Run-off and Flood Prediction for the Muddy - PowerPoint Presentation

myesha-ticknor
myesha-ticknor . @myesha-ticknor
Follow
379 views
Uploaded On 2018-03-13

Run-off and Flood Prediction for the Muddy - PPT Presentation

River By Erik Robison Problematic flooding occurs in Moapa Valley approximately once every 10 years If these floods are occurring every 10 years what would be the magnitude and flooding extent of a 100 year storm ID: 649905

100 storm data year storm 100 year data basin determine flooding cover precipitation land event drainage soil runoff flow

Share:

Link:

Embed:

Download Presentation from below link

Download Presentation The PPT/PDF document "Run-off and Flood Prediction for the Mud..." is the property of its rightful owner. Permission is granted to download and print the materials on this web site for personal, non-commercial use only, and to display it on your personal computer provided you do not modify the materials and that you retain all copyright notices contained in the materials. By downloading content from our website, you accept the terms of this agreement.


Presentation Transcript

Slide1

Run-off and Flood Prediction for the Muddy

River

By Erik RobisonSlide2

Problematic flooding occurs in Moapa Valley approximately once every 10 years.

If these floods are occurring every 10 years what would be the magnitude and flooding extent of a 100 year storm.

The ProblemSlide3

Determine the Magnitude of a 100 year storm event on the Muddy River catchment basin. Route the 100 year storm runoff through Moapa Valley, to determine extents of Flooding.

The ObjectiveSlide4

Data from NHDPlus

was used to develop a

DEM, Flow Accumulation, Flow lines, and Flow Direction of the area (30 m x 30 m cell size)

Rainfall data was collected from the NOAA website for the area to determine the 100 year storm event

Precipitation

intensity

and duration

Soil data

was obtained from the NRCS (National Resources conservation Services)Land cover was obtained from ArcGIS online (National Land Cover Data set)

DATA SOURCESSlide5

Precipitation events for a 100 year storm were evaluated at a 100 year return period and 24 hour duration on the catchment basin.

Approximately 2.62

inches

Note:

The actual precipitation

number may be smaller than

calculated,

because the drainage basin is large, and a storm event may not cover the entire basin. Slide6

The Land Cover Data, and soil data were used to determine SCS curve numbers for the Drainage Basin.

A

B

C

D

77

86

91

94

36

60

73

79

Approximately 89% of the land cover in this drainage is Barren soil, with a few

Mixed

Forests, and less than 1% development.

Barren Soil

Q


S -10


Q = runoff (in)P = precipitation (in)Ia = Initial Abstraction (in)CN = Curve Number

Mixed

forestSlide7

Large accumulations of Runoff are present due to the size of the drainage basin Flooding will continue to be an issue until changes to the environment occur

ConclusionsSlide8

Due to the lack of sufficient cross-section information, routing the 100 year storm to determine the extents of flooding isn’t possible.

Future

assessments of the basin would be necessary to determine the extents of flooding during a 100 year storm event (HEC-RAS).

Work to modify the river system to accommodate a 100 year storm is currently underway (modification of the current cross-sections).

Additional ResearchSlide9

Questions?