/
Flood Predictions in Smithfield and Birch Creek Canyons res Flood Predictions in Smithfield and Birch Creek Canyons res

Flood Predictions in Smithfield and Birch Creek Canyons res - PowerPoint Presentation

luanne-stotts
luanne-stotts . @luanne-stotts
Follow
384 views
Uploaded On 2017-03-23

Flood Predictions in Smithfield and Birch Creek Canyons res - PPT Presentation

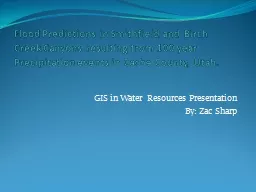
GIS in Water Resources Presentation By Zac Sharp Project Outline Project Description Objective Base Map Construction Catchment Attributes Rain Fall Data Rational Flood Prediction HEC HMS Flood Prediction ID: 528339

flood max cfs flow max flood flow cfs rain fall linear hms rational objective project catchment attributes data results

Share:

Link:

Embed:

Download Presentation from below link

Download Presentation The PPT/PDF document "Flood Predictions in Smithfield and Birc..." is the property of its rightful owner. Permission is granted to download and print the materials on this web site for personal, non-commercial use only, and to display it on your personal computer provided you do not modify the materials and that you retain all copyright notices contained in the materials. By downloading content from our website, you accept the terms of this agreement.


Presentation Transcript

Slide1

Flood Predictions in Smithfield and Birch Creek Canyons resulting from 100 year Precipitation events in Cache County, Utah.

GIS in Water Resources Presentation

By:

Zac

SharpSlide2

Project OutlineProject Description

Objective

Base Map Construction

Catchment Attributes

Rain Fall Data

Rational Flood Prediction

HEC HMS Flood Prediction

ResultsSlide3

Project DescriptionFlood in 1983

Channel construction

New city offices

Catchment description

Two flood modelsSlide4

ObjectiveThe objective of this study is to determine, with reasonable certainty, the flow in summit creek through the city of Smithfield during design precipitation events.Slide5

Base Map ConstructionSub basin information from

NHDplus

.

DEM from the USGS seamless server.

Soil attributes from the Utah GIS portal.

All flood model parameters come from the base map.Slide6

Catchment Attributes

Basin

(#)

Area

(sq. miles)

Soil/Curve

No.

(#)

L

(mi)

Lc

(mi)

S

(ft/mile)

Lag

(hrs)

1

1.69

B/70

2.08

1.01

1173.7

0.72

2

0.56

B/70

0.92

0.74

2024.8

0.45

3

0.87

B/70

1.29

0.81

1456.3

0.55

4

.052

B/70

.21

.15

946.5

0.32

5

2.76

B/70

1.90

1.17

348.5

0.89

6

1.91

B/70

2.42

1.65

1261.9

0.87

7

2.01

B/70

1.78

1.30

1295.6

0.73

8

8.21

B/70

6.12

4.12

257.5

2.09

9

5.03

B/70

5.29

3.78

437.1

1.77 Slide7

Rain Fall DataSlide8

Rain Fall DataSlide9

Rational Flood PredictionQ = C*

i

*A.

C is 0.17.

1 and 24 hour

storms.Slide10

HEC HMS

Rain fall distributions for each catchment.

SCS curve number method to compute runoff hydrographs.

Muskingham method to route hydrographs through main channelsSlide11

ResultsRational Method

HEC HMS

1 hr max flow = 715 cfs

24 hr max flow = 5580 cfs

1 hr linear max = 715 cfs

24 hr linear max = 610 cfs

1 hr max flow = 479 cfs

24 hr max flow = 5813 cfs

1 hr linear max = 483 cfs

24 hr linear max = 2372 cfsSlide12

ResultsCulvert Master analysis shows max flow is 383 before flooding will occur.

Conclusion: Put the building somewhere else.