/
Figure 1 Figure 1

Figure 1 - PowerPoint Presentation

natalia-silvester
natalia-silvester . @natalia-silvester
Follow
361 views
Uploaded On 2016-03-04

Figure 1 - PPT Presentation

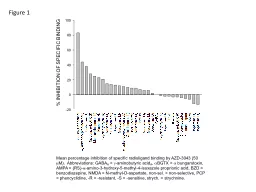
Mean percentage inhibition of specific radioligand binding by AZD3043 50 M Abbreviations GABA A aminobutyric acid A BGTX bungarotoxin AMPA RS ID: 241928

state activity azd electroencephalographic activity state electroencephalographic azd 3043 propofol administration fully figure representative line vertical rat coincides data

Share:

Link:

Embed:

Download Presentation from below link

Download Presentation The PPT/PDF document "Figure 1" is the property of its rightful owner. Permission is granted to download and print the materials on this web site for personal, non-commercial use only, and to display it on your personal computer provided you do not modify the materials and that you retain all copyright notices contained in the materials. By downloading content from our website, you accept the terms of this agreement.


Presentation Transcript