/
Historical context for today’s Historical context for today’s

Historical context for today’s - PowerPoint Presentation

natalia-silvester
natalia-silvester . @natalia-silvester
Follow
346 views
Uploaded On 2018-09-24

Historical context for today’s - PPT Presentation

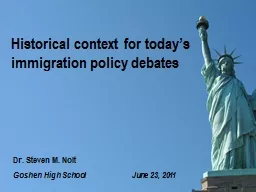
immigration policy debates Goshen High School June 23 2011 Dr Steven M Nolt The big picture Patterns of immigration in US history and some implications for today ID: 677586

immigrants immigration 1920 population immigration immigrants population 1920 differences policy similarities born 1965 percentage education foreign today history border

Share:

Link:

Embed:

Download Presentation from below link

Download Presentation The PPT/PDF document "Historical context for today’s" is the property of its rightful owner. Permission is granted to download and print the materials on this web site for personal, non-commercial use only, and to display it on your personal computer provided you do not modify the materials and that you retain all copyright notices contained in the materials. By downloading content from our website, you accept the terms of this agreement.


Presentation Transcript

Slide1

Historical context for today’s

immigration policy debates

Goshen High School June 23, 2011

Dr. Steven M. NoltSlide2

The

big picture

:

Patterns of immigration in U.S. history and some implications for

today

Immigrants then and now:

Five similarities and differences

Origins of immigration restriction and the beginning of legal/illegal immigration (1882-present)Current (1965) framework for immigration policy: Changes and unintended consequences

Outline of presentation:Slide3

CLARIFYING TERMINOLOGY:

Authorized immigration/unauthorized immigration

• “Immigration” and choiceSlide4

THE BIG PICTURE:

Patterns

of immigration in U.S.

history

Immigration is a multi-sided process

Push factors, pull factors, and means of travel

Talking about U.S. immigration policy is one part of a larger international puzzleSlide5

Movement of people,

movement of borders:

Two examples:

Example 1: In the 1600s and 1700s, supply and demand for labor resulted in a great deal of forced immigration from Africa and EuropeSlide6

Status of immigrants to what would become the United States (%)

Years

Slaves Prisoners

Indentured Free

servants

labor1607-1699 17 1 49 331700-1775 47 9 18 26Source: Aaron S. Fogleman, “From Slaves, Convicts, and Servants to Free Passengers: The Transformation of Immigration in the Era of the American Revolution,”

Journal of American History

85 (June 1998), 43-76.Slide7

Example 2: In 1848, the U.S. border crossed about 75,000 people living in northern Mexico.Slide8

Immigration has been a major factor in the U.S. population and economy from the 1600s to the 2000s

Two exceptional periods when immigration was less common: 1775-1815 and 1925-1965

Every year, more people have entered the U.S. than have left, except for 1932-1935Slide9

Another part of the pattern: Reverse migration; people leave the U.S. to return to their country of origin

For many European immigrants, coming to America was a strategy to make money to send back or take back to country-of-origin

Between 1860-

1930, somewhere between 1/3 and 1/2 of all immigrants to the

United States did not stay permanently.Slide10

Remigration Rates: 1890-1930

Bulgarians

87 %

Romanians 66 %Russians

65 %Greeks 54 %Hungarians 47 %

Italians 46 %

Slovaks 36 %

Poles 33 %French 24 %Finns 22 %Examples from Thomas Archdeacon, Becoming American: An Ethnic History (New York: Free Press, 1983), p. 139.Slide11

A final pattern:

For much of U.S. history, the percentage of the U.S. population that was foreign born was a constant 13-14%Slide12

Foreign born as percentage of U.S. population

1860 13.2 %

1870 14.0

1880 13.3

1890 14.7 1900 13.6 1910 14.7

1920 13.2

1930 11.6Slide13

The lowest point in the foreign-born percentage of the U.S. population was 1970

In 1970, only 4.7 % of the U.S. population was foreign born (and they were disproportionately elderly)Slide14

Foreign born as percentage of U.S. population

1860 13.2 %

1870 14.0

1880 13.3

1890 14.7 1970 4.7 %1900 13.6 1910 14.7 1990 7.9

1920 13.2 2000 11.1

1930 11.6 2009 12.5Slide15

Immigrants then and now:

Five

similarities and differences

1. ORIGINS: 1820-1920

– 85% from

Europe Today – 75

% from Latin America and Asia 40% of today’s immigrants come from five countries:MexicoIndiaChina

Philippines

Vietnam Slide16

Immigrants then and now:

Five similarities and differences

2. AGE AND FAMILY PROFILE:

1820-1920

Overwhelmingly single young adult men

Today

– Still disproportionately youth and young adult, but more balanced sex-ratios and more familiesSlide17

Immigrants then and now:

Five similarities and differences

3. EDUCATION LEVEL:

1820-1920 – Typically had

less formal education than general population

Today

Typically have less and more formal education than general populationSlide18

Education level of

immigrants (age 25

+) in New York

City, late 20th century

Source

: Nancy

Foner

,

From Ellis Island to JFK: New York’s Two Great Waves of Immigration

(Yale, 2000

).

Education completed by post-1965 immigrants aged 16-64, and native-born population.Slide19

Immigrants then and now:

Five similarities and differences

4

. SOCIALLY:

A similarity between 1820-1920 and today – the most recent immigrants

face

resistance or resentment from other

AmericansSlide20

Immigrants then and now:

Five similarities and differences

5

. POLITICALLY:

Prior to 1920 in many

places,

immigrant men could vote even if they were not naturalized. This is a difference between then and now, and gave European immigrant communities a bit more political influence in shaping the society that they were joining.Slide21

Origins of immigration restriction and the beginning of legal/illegal immigration

Immigration and the Constitution

1875 U.S. Supreme Court: immigration is exclusively federal domainSlide22

1882 CHINESE EXCLUSION ACT

Began a process of seeking to limit immigration to “desirable” populations

1907 ban on Japanese immigration

1917 general ban on immigration from all of Asia (except Philippines)Asians were “aliens ineligible for citizenship”Slide23

OTHER EXAMPLES OF RESTRICTING IMMIGRATION

1891 barred insane, paupers, those persons

suffering from

contagious

disease, felons, polygamists, and (after 1903) anarchists. In

percentage terms,

few turned away for any of these reasons (less than 1%)

1917 Literacy testRestriction movement culminated in National Origins Act (1924) that banned immigration from Asia and severely limited immigration from eastern and southern Europe. No numeric limits on Canada or Latin AmericaSlide24

After 1882, with immigration limited for the first time, it was now possible to have unauthorized entry (illegal immigration)

Excluded Europeans and Asians went to Canada or Mexico and crossing into U.S.Slide25

U.S. Supreme Court grappled with the constitutional implications of

restricted

immigration: Did government have the power to deport, and if so, on what grounds?

1893 Fong Yue Ting v. U.S.

Federal power to deport, but it is a civil proceeding not a criminal one1924 creating of U.S. Border PatrolSlide26

Special situation of immigration from Mexico

• Combination

of legal welcome and ill-treatment (

examples from 1910s and 1930s)Congress repeatedly exempted Mexico from immigration restriction

measures Congressmen from Western states and Texas very much wanted Mexican workers and wanted an open trade border with MexicoBracero

program for ‘guest workers’ (1942-1964

)

4.7 million participants“Operation Wetback,” 1954Slide27

Our current framework

for immigration policy:

Changes and

unintended consequencesCold War political pressure to reform immigration policy culminated in 1965

Hart-Celler Act:Did away with the 1924 racially-discriminatory categories for the Eastern Hemisphere,

but

placed Western Hemisphere under quota limit for the first time.

Ended Bracero program.Retained a cap on number of immigrants each year, but now allotted visa slots in a way that deemphasized work skills and employment preferencesSlide28

Consequences of 1965 immigration reform

Immigration

from Asia swelled

Immigration from Latin America was suddenly restricted in significant ways

Employment-based visa allotments do not match labor supply and demandBy the late 1970s, unauthorized immigration had become a major political debateSlide29

Federal policy debates

President Ronald Reagan combined tighter border enforcement with path to citizenship for unauthorized immigrants (1986)

Since 1990, emphasis has been on border enforcement. Not much interest in changing visa allotments. Not much attention to the larger push-and-pull factors behind immigration