/
Utah Lake Nutrients Utah Utah Lake Nutrients Utah

Utah Lake Nutrients Utah - PowerPoint Presentation

natalia-silvester
natalia-silvester . @natalia-silvester
Follow
348 views
Uploaded On 2018-10-14

Utah Lake Nutrients Utah - PPT Presentation

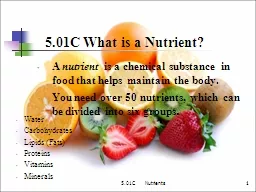
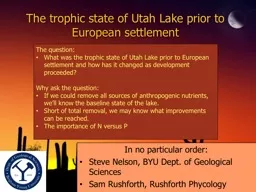
Lake and Nutrient Loading LaVere B Merritt Prof Emeritus BYU 30 March 2017 Utah Lake Nutrients Utah Lakes nature shallow slightly saline turbid eutrophic in semiarid region Indications are that the lake has been this way since it stabilized after Lake Bonneville last receded ID: 689605

utah lake eutrophic nutrients lake utah nutrients eutrophic 100 phosphorus algae trophic water lakes hyper growth precipitation light level

Share:

Link:

Embed:

Download Presentation from below link

Download Presentation The PPT/PDF document "Utah Lake Nutrients Utah" is the property of its rightful owner. Permission is granted to download and print the materials on this web site for personal, non-commercial use only, and to display it on your personal computer provided you do not modify the materials and that you retain all copyright notices contained in the materials. By downloading content from our website, you accept the terms of this agreement.


Presentation Transcript

Slide1

Utah Lake Nutrients

Utah

Lake and Nutrient Loading

LaVere

B. Merritt

Prof. Emeritus, BYU

30 March 2017Slide2

Utah Lake Nutrients

Utah Lake’s nature:

shallow

slightly saline

turbid

eutrophic

in semi-arid region

Indications are that the lake has been this way since it stabilized after Lake Bonneville last receded some 8000 to10,000

yrs

ago. Slide3

Utah Lake Nutrients

Eutrophication might be generally defined as:

Increasing aquatic plant growth and overall biological productivity in a water body over the years.

Sometimes this results in significant losses

in water

quality.

Natural

eutrophication usually takes hundreds or thousands of years, or

more. but is often accelerated by human activities

.Slide4

Utah Lake Nutrients

Trophic level classification for lakes:

Oligotrophic

(low bio-productivity, clear )

Mesotrophic

(moderate “ ,slightly turbid)

Eutrophic

(high “ , turbid )

Hyper eutrophic

(very high “ , very turbid )

Turbidity

a

s used here is mainly due to increased algae and other biological organisms in the water—biological turbidity.Slide5

Utah Lake Nutrients

An oligotrophic lakeSlide6

Utah Lake Nutrients

A mesotrophic lakeSlide7

Utah Lake Nutrients

Eutrophic lakesSlide8

Utah Lake Nutrients

A hyper-eutrophic lakeSlide9

Utah Lake Nutrients

Most lakes eventually become marshland—then meadows—then “basin” land Slide10

Utah Lake Nutrients

Types of problems that

might

occur in eutrophic lakes:

Turbid water from prolific algal and other biological growth

Significant floating algae and other bio-debris

Accumulations

of unsightly

bio-debris

along

shorelines

Loss

of

oxygen—sometimes total loss—”normal”

biota

stressed.

“Mucky”, often septic, conditions at the bottom

Bad odors

Heavy swarms of insects and aquatic bugs

Conditions that favor “coarser” fish and other aquatic life

“Troublesome” residual decomposition compounds in the wate

rSlide11

Utah Lake Nutrients

But note—

Most of the “problems” with eutrophic lakes relate to on-site

aesthetics and recreation

—and generally not to primary water quality concerns with public health or community sanitation (disease and filth).

I.e., most eutrophic issues relate to

“How pristine and scenic is the lake?”

“does it look good and smell okay?”

We all like pristine, clear waters along with their amenities, but even with no changes by humans most waters have considerable “aesthetic quality” problems. I.e., most lakes naturally have some of the problems associated with “eutrophic” conditions.

Rivers/steams can also have algae-caused water quality problems but usually to a lesser extent that lakes do.Slide12

Utah Lake Nutrients

Main factors determining plant growth:

Light (sunshine)

Nutrients (

phos

., nitro., other vitamins and minerals

)

Toxicants

Temperature

Time

Variability

in

factors

Competition

Grazing/HarvestingSlide13

Utah Lake Nutrients

Man

Was

Her

ESlide14

Utah Lake Nutrients

Conditions on Utah Lake

Typical turbidity during the summerSlide15

Utah Lake Nutrients

Empty elevationSlide16

Utah Lake Nutrients

Table

1.

Utah Lake Inflows:

Avg

Salt and Water Quantities for 2009-2013

.

______________________________________________________________________________________

I.

INFLOW

Flow | Percent of Inflowing S a l t s

| %

of Nutrients|

1

.

Surface

af

/

yr

% _ TDS Na Ca Mg K Cl HCO3 SO4 TP DN DP

a

.

Mtn

Strms

287862. 52.0 24.3 12.9 42.5 28.3 14.5 10.0 39.6 19.6 7.0 14.5 4.2

b. WWTP 53126. 9.6 11.0 12.9 8.9 9.0 14.2 14.3 10.4 6.3

79. 54.7

85.5

c. Main L-other 77799. 14.1 17.3 12.4 16.6 24.1 15.2 9.8 22.1 27.8 7.6 17.5 6.2

d. Provo B-other 53232. 9.6 9.8 4.8 13.0 11.8 7.6 4.6 12.1 11.4 1.6 5.5 1.3

e. Gosh. B-other

23073. 4.2 14.0 24.1 3.2 10.1 17.5 23.7 3.4 14.3 1.6 2.3 1.5

1. Subtotal: 495092. 89.5 76.4 67.1 84.2 83.3 69.0 62.5 87.6 79.4

96.8 94.6 98.7

2

.

Fresh

Grnd

water

a. Main L-

gw

31640. 5.7 3.3 1.9 3.9 5.2 3.4 1.7 5.2 2.7 0.4 1.8 0.3

b. Gosh. B-

gw

11531. 2.1 3.0 3.4 2.1 3.9 4.7 3.8 2.3 2.9 0.1 0.7 0.1

2. Subtotal: 43171. 7.8 6.2 5.2 6.0 9.0 8.0 5.4 7.5 5.6 0.5 2.4

0.4

3

.

Thermal/Mineral GW

a. Main-min

sprs

13957. 2.5 16.7 26.8 9.5 7.0 22.6 31.1 4.6 14.5 0.3 0.1 0.3

b. Gosh. B-m

sprs

787. 0.1 0.3 0.6 0.1 0.1 0.4 0.5 0.1 0.4 0.0 0.0 0.0

3. Subtotal:

14744. 2.7 17.1 27.4 9.6 7.2 23.0 31.6 4.7 14.9 0.4 0.1 0.3


1,2& 3

subtot

553007. 100.0 99.7 99.8 99.8 99.5100.0 99.5 99.9 99.9 97.7 97.0 99.4

4.

Precipitation

a. Main Lake 52884

.

b. Provo Bay

8633

. c. Goshen

Bay

31649.

4.Total

Precip

93164.

0.3 0.2 0.2 0.5 0.1 0.5 0.1 0.1 2.3 3.0 0.6

100. 100. 100. 100. 100. 100. 100. 100. 100. 100. 100.

INFLOW TOTAL

646171

.

II.

Outflow.

1.

Jordan River

336045.

2.

Evaporation

a. Main Lake 218073

.

b. Provo Bay

32133. c

. Goshen Bay

92602

.

2. Subtotal 332808.

II. Outflow tot 668853.

Lake Storage

-22682.

Net 646171.

TDS

Na

Ca

Mg K Cl

HCO3

SO4

TP

DN

DP

Ratio: salts out/salts in:

85. 108. 39. 107. 109. 110. 54. 110.

9.4 17.1 9.4

Approx.

corrected

for lake volume change:

79

.

101.

36

. 100. 102. 103.

50

.

103

.

8.7

15.9

8.7 Slide17

Utah Lake Nutrients

Table 2 . Utah Lake nutrient inflows and outflow—2009-2013.

Nutrient

LoadIngs

--

ton/

Yr

TP

DN

DP

1.

Surface Inflow

af

/

yr

%

%

a.

Mtn

Strms

287862. 52.0 19

7

311

10

b.

POTW

53126. 9.6 215

79

1174

196

c. Main L-other 77799. 14.1 21

8

375

14

d. Provo B-other 53232. 9. 4

1

118

3

e. Gosh. B-other

23073. 4.2

4

1

50

3

1. Subtotal: 495092. 89.5

264

97

2028

226

2.

Fresh

Grnd

water

Subtotal

: 43171.

7.8 1

51

1

3.

Thermal/Mineral GW

Subtotal:

14744.

2.7

1

2

2

1,2& 3

subtot

553007. 100.0

4.

Precipitation (rain and snow)

Total

Precip

93164.

6

2.2

64 1

INFLOW TOTAL

646171.

272

2145

229


II.

Outflow.

1.

Jordan

River

33604.

26

9.6

367 22

2.

Evaporation

332808.

II. Outflow tot

668853.

Change in Storage

-22682.

TP

%

DN DP

Net 646171.

26

9.6

367 22

Lost--

precipitated

in the Lake

246

90.4

1778

207

_______________________________________________________

these values are under final review and may change slightly Slide18

Utah Lake Nutrients

Table 3. Nutrient Loadings to Utah Lake by water year, 2009 – 2013

________________________________________________________

Water Year

Phos

.

tons/

yr

SRP

tons/

yr

Nitrogen

tons/

yr

2009

277 232 2235

2010 257 219 1813

2011 327 267 2872

2012 247 211 1812

2013

252

216

1816

Average

272

229

2145

Slide19

Utah Lake Nutrients

Utah

Lake has natural

high turbidity,

Why?

In-lake chemical precipitation

of

calcium-carbonate-silica-phosphorus (largely clayey Marls) adds a natural, cloudy, mineral turbidity.

(

removes some

100,000 tons of dissolved minerals per

yr

--this

results in an avg. of about 2” of bottom sediments per

100 yrs.)

Secchi

Disk readings

indexes

light

penetration.

(

Typically at 2x to 3x the

Secchi

depth there isn’t enough light for appreciable

algae growth—During

the summer,

Secchi

depths in Utah Lake are

usually

less than 1 ft. (0.3 m)—indicating very high turbidity and

very limited algae growth below 1 to 2

ft

deep.)Slide20

Utah Lake Nutrients

Light limitation?

Cont.

Avg

. depth of Lake is about 9 ft. Frequent waves stir up and re-suspend the flocculent, precipitated sediments resulting in turbid,

light-limiting,

algae-growth conditions

most

of the

time.

Ans

: Overall Utah Lake algae growth is light-limited!Slide21

Utah Lake Nutrients

Might P & N possibly be limiting?

To answer this question, consider:

What are the actual in-lake

conditions?

What do predictive Trophic Level models indicate?Slide22

Utah Lake Nutrients

1. What

are the actual in-lake conditions

?

Carlson Trophic State Index

(In-lake conditions—normally use the average of summer conditions)

Utah Lake in

red

:

Trophic Index

Chl

a (

ug

/l)

P (

ug

/l)

Secchi

Disk (m

)

Trophic Class

<30—40

0—2.6

0—12

>8—4

Oligotrophic

40—50

2.6—20

12—24

4—2

Mesotrophic

50—70

20—56

24—96

2—0.5

Eutrophic

70—100+

56—155+

96—384+

0.5—<

0.25

Hyper-eutrophic

The hyper-eutrophic indication from

Secchi

Disk readings is a false indicator for Utah Lake since the low values are mainly due to mineral turbidity—not biological turbidity.Slide23

Utah Lake Nutrients

Conclusion:

Based on Lake data, the

actual biological

status of

Utah Lake is

“eutrophic”, not ultra hyper-eutrophic as predicted by models!Slide24

Utah Lake Nutrients

Trophic State Models

2. What

do the

predictive trophic

level models tell us?

Larsen-Mercier Trophic State Mode

l

(developed by EPA scientists—improvement on the original

Vollenweider

Model.)

Model uses:

annual average concentration of phosphorus in inflowing waters.

lake residence time and depth.

Predicts

the expected lake trophic level.

(but only if phosphorus is the controlling limiting factor in the lake)

The following chart also shows results for other lake evaluations done in about 1975. Slide25

Utah Lake Nutrients

Utah Lake

Strawberry Res.

Strawberry Reservoir

Utah Lake

~220

ug

/l

1975

Predicted Trophic State based on the Larsen-Mercier Model

Eutrophic Zone

Mesotrophic

Oligotrophic

Hyper-Eutrophic Zone

Utah Lake

634

ug

/l

2008-2013

500Slide26

Utah Lake Nutrients

Is P limiting?

Ans

: The L-M model predicts ultra-hyper eutrophic level but the actual condition is eutrophic.

Therefore: P is not limiting!

Might P be made limiting?

Remove POTW sources.

POTWs: About 80% of the Lakes P loading currently comes from them.

90-95% removal at POTWs would cost perhaps $300 million in construction costs and tens of millions in annual O&M costs

.

Remove Nonpoint sources (NPS)—

As much as 25% of the remaining P

might

be removed with rigorous NPS controls.

Costs would be staggering—likely $100s of millions to get to a reliable 25% reduction in all other phosphorus loadings to the lake.

What is the L-M predicted result of such efforts?Slide27

Utah Lake Nutrients

Utah Lake

Strawberry Res.

Strawberry Reservoir

Utah Lake ~1975

Predicted Trophic State based on the Larsen-Mercier Model

Eutrophic Zone

Mesotrophic

Oligotrophic

Hyper-Eutrophic

Loading Utah Lake

2008-2013

634

ug

/l

500

-100%

P

removal @ POTWs

-Plus 25% all

other

P

withSlide28

Utah Lake Nutrients

The New Big

OH MY!

Atmospheric Precipitation: Rain, snow, dry deposition

Concentrations (tentative): (4 mons of data)

TP:

about 150

ug

/l

DN:

about 2000

ug

/l

And these don’t include dry deposition.

Utah lake:

Annual wet precipitation: 1

ft.yr

Lake depth: 4 to 9

ft

over “normal wet and dry cycles.

Bomb Shell

:

Atmospheric Precipitation alone provides eutrophic loadings of nutrients to the Lake--

No way can Utah Lake algae growth ever be limited by nutrient

contol

/removal!!!Slide29

Utah Lake Nutrients

Utah Lake

Strawberry Res.

Strawberry Reservoir

Utah Lake ~1975

Predicted Trophic State based on the Larsen-Mercier Model

Eutrophic Zone

Mesotrophic

Oligotrophic

Hyper-Eutrophic

Loading Utah Lake

2008-2013

634

ug

/l

500

-100% POTW removal

-

Plus 25% all other

Utah Lake

Actual now

WithSlide30

Utah Lake Nutrients

Looking at the actual nutrient balance information—

Consider the actual phosphorus retention in the Lake

(90%)

.

If the Lake were a “normal” phosphorus-limited lake then P retention would be about 50%--and the Jordan River would have ~300

ug

/l rather than the ~50

ug

/l found in the exiting River.

But its actual retention is about 90%--this means there are some rather dramatic, extraordinary, removal mechanisms occurring in the lake:

There are–

Likely the main one is precipitation

in the mineral precipitates (largely Marl clays) to the bottom sediments.

The “take- away”

:

Utah Lake is not a normal lake as to phosphorus—it has an almost unlimited capacity to trap P into the bottom sediments where it’s relatively unavailable to algae!

One might say that it’s doing a better job of P removal than any engineered Tertiary Treatment Plant could ever do—and it’s natural, organic, and

Free!Slide31

Utah Lake Nutrients

Again—where is over 90% of the inflowing

Phos

. going?

Since the

Lake has:

High pH

High oxygen levels

Abundant

Calcium, Carbonate,

Silica and

Phosphorus.

Ans

—To the sediments via mineral precipitation.

and

Precipitation of Marl & other minerals reduces available soluble phosphorus to relatively low levels—

About 50

ug

/l

But even then

Phos

. is not limiting algae growth most of the time; 50

ug

/l would still make the lake more eutrophic than it actually is—

if it weren’t for

Light limitation

due to the lakes natural mineral turbidity!Slide32

Utah Lake Nutrients

Another piece of evidence—

Algal assay results

(Don

Porcella

, USU, 1975)

Algae-growth assays on filtered Utah Lake water indicated that phosphorus was “bound” and only slowly became available.

–Much slower than algae could have used it (grown) otherwise.

I.e., when available P was largely used up by growing algae, it took relatively long times for more P to be released from the “bound” forms (tiny precipitated, flocculent particles).Slide33

Utah Lake Nutrients

Summary:

Overall,

indications are

that

light-limitation

limits

Utah Lake

to a

natural eutrophic

condition

—if this were not the case the lake would be ultra-hyper eutrophic and

of horrible

quality. In fact, the

lake

would of likely disappeared (filled in) long ago and just be a swampy margin along an upward extension of the Jordan River.

Phosphorus loading to the lake is some 15 to 20 times larger than that needed to support its eutrophic level.

Most of the phosphorus is precipitated and bound in the lakes bottom sediments.

Nitrogen loading is also about 15+ times larger

than eutrophic level.

Most nitrogen is likely de-nitrified to harmless nitrogen gas at the lake bottom-sediment interface

.

It is

extremely unlikely

that removal of even all of the phosphorus coming from POTWs, plus 25% of the remaining loads, would significantly lower the lakes natural eutrophic level.

Phosphorus in

the Jordan River at the

lake

outlet

is

quite low

(about 50

ug

/l) and determined

largely by chemical equilibria with

the precipitated sediments —and

not

determined by the

amount of phosphorus coming into the

lake

.

Slide34

Utah Lake Nutrients

Conclusion:

It

is

highly

probable that the lake would be essentially the same quality as

now,

even if every nutrient source were reduced to the highest degree

possible—at

a cost of many hundreds of millions of

dollars.

(We would simply be paying a gigantic price to remove the phosphorus that is now removed

free

by mother nature—to the bottom sediments)Slide35

Utah Lake Nutrients