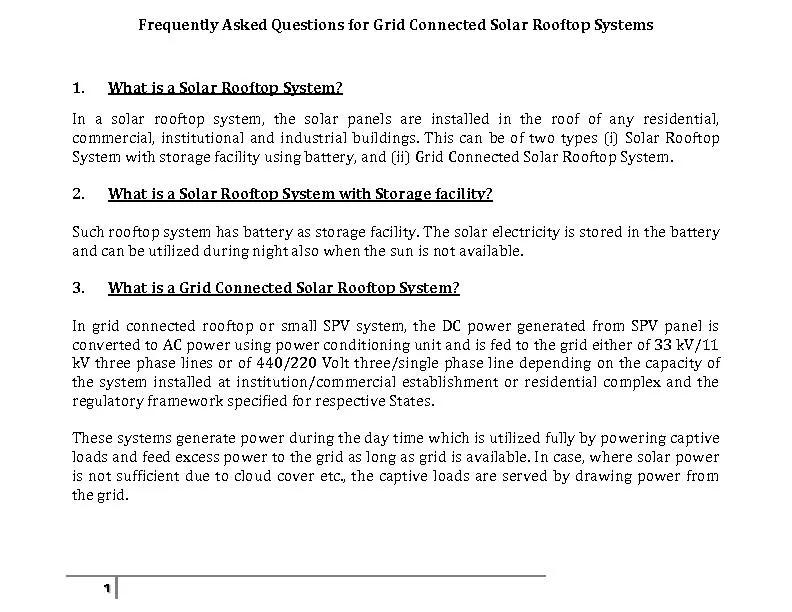
Ryan M Liddell Faculty advisor Dr Joe Bishop Photo Copyright H Brothers Inc used by permission Interest in PV for Seattle Black amp Veatch Renewable Energy group Personal interest in sustainability ID: 696509
Download Presentation The PPT/PDF document "Estimating Rooftop Solar Electricity Pot..." is the property of its rightful owner. Permission is granted to download and print the materials on this web site for personal, non-commercial use only, and to display it on your personal computer provided you do not modify the materials and that you retain all copyright notices contained in the materials. By downloading content from our website, you accept the terms of this agreement.
Slide1
Estimating Rooftop Solar Electricity Potential in Seattle from LiDAR Data
Ryan M. LiddellFaculty advisor: Dr. Joe Bishop
Photo Copyright H Brothers Inc; used by permission.Slide2Slide3
Interest in PV for Seattle
Black & Veatch Renewable Energy groupPersonal interest in sustainability
Considering PV for my roof
Image courtesy ofSlide4
Presentation Outline
Project Objectives & TimelinePV feasibility in Seattle
Workflow for GIS-based Estimate of CapacityQuestionsSlide5
Project Objectives
Examine feasibility of photovoltaic (PV) systems in SeattleGenerate urban 3D model of Seattle
Identify rooftops suitable for PV installationsEstimate total solar electricity production capacity for the City of SeattleSlide6
Project Timeline
Examine feasibility of PV in Seattle: Complete
Generate urban 3D model: July-August
Identify suitable rooftops:
August
Estimate total PV production capacity for the City of Seattle:
SeptemberSlide7
How Photovoltaic Systems Work
Image: Clean Energy AssociatesSlide8
Solar
insolationLatitude:
Short winter daysLong summer days
Local weather, especially cloud cover
Temperature – cooler is more efficient
Germany produced 6,200
GWh
in 2009*
Technical Feasibility of PV in Seattle
*Source: "Development of Renewable Energy Sources in Germany 2009". Federal Ministry for Environment, Nature Conservation and Nuclear Safety. http://www.erneuerbare-energien.de/files/pdfs/allgemein/application/pdf/ee_in_deutschland_graf_tab_2009_en.pdf. Slide9Slide10
Economic Feasibility in Seattle
Nearly 90% of electricity from hydropower
$$$ is 30% less than the national averageWinter
High demand, lower supply
City Light buys cheap electricity on market
Summer
Low demand, high supply
City light sells at high price on market
Sources: Seattle City Light; U.S. Energy Information Administration Independent Statistics and AnalysisSlide11
Economic Incentives
30% federal tax credit for PV system costNo Washington sales tax
Washington State 6170 program:
Purchases solar generated electricity
Starts at 15¢ per kWh
Up to 54¢ per kWh
Max: $5000 per year
Net Metering through Seattle City LightSlide12Slide13
Potential Effects of Climate Change
Reduced snowpack
Peak stream flows earlier in yearWinterDecreased demand for electricity (heating)
Increased supply of hydro power
Summer
Increased demand (Air Conditioning)
Decreased supply of hydro power
Changes in Water Management for Salmon
Source: Washington Economic Steering Committee and the Climate Leadership Initiative Institute for a Sustainable EnvironmentSlide14
Estimating PV Production CapacitySlide15
Estimating PV Production CapacitySlide16
Airborne LiDAR Basics
From: http://www.dot.state.oh.us/Divisions/ProdMgt/Aerial/Pages/LiDARBasicS.aspxSlide17
Available LiDAR Data
Puget Sound LiDAR ConsortiumFlown in 2000 & 2002
Nominal 1 pulse per m2Bare Earth and Top Surface DEMs: 6ft res
All-Returns ASCII files
Source: Puget Sound LiDAR Consortium.Slide18
Available LiDAR Data
King County GISDigital Ground Model (DGM) TIN
Digital Surface Model (DSM) TINFor both, nodes provide same level of control as ASCII point files.
Intensity data
Source: King County GIS Center.Slide19
Hillshade derived from KC DSM nodesSlide20
Estimating PV Production CapacitySlide21
Extraction of Buildings from LiDAR Data
Lots of research over the past 10 yearsPriestnall, et al.
2000. Extracting Urban Features from LiDAR Digital Surface Models.
Haithcoat, et al.
2001
. Building Footprint Extraction and 3-D Reconstruction from LiDAR Data.
Elaksher and Bethel.
2002
. Reconstructing 3D Buildings from LiDAR Data.
Rottensteiner.
2003
. Automatic Generation of High-quality Building Models from LiDAR Data.
Vosselman, et al.
2005
. The Utilization of Airborne Laser Scanning for Mapping.
Verma, et al.
2006
. 3D Building Detection and Modeling from Aerial LiDAR Data.
Sampath and Shan.
2007
. Building Boundary Tracing and Regularization from Airborne Lidar Point Clouds.
Q.-Y. Zhou and U. Neumann.
2008
. Fast and Extensible Building Modeling from Airborne LiDAR Data.
Vu, et al.
2009
. Multi-scale Solution for Building Extraction from LiDAR and Image Data.
and many more…Slide22
Building Extraction Algorithms
From: Q.-Y. Zhou and U. Neumann. Fast and Extensible Building Modeling from Airborne LiDAR Data. 2008.Slide23
Some LiDAR Software with Feature Extraction CapabilitiesSlide24
From: G. Zhou, et al. Urban 3D GIS From LiDAR and digital aerial images. 2003.Slide25
Estimating PV Production CapacitySlide26
Goals for 3D Urban Model
Successful segmentation of featuresRealistic modeling of rooftop geometry
Accurate representation of tree canopy heightAccurate representation of terrainSlide27
Estimating PV Production CapacitySlide28
Anlaysis of 3D Urban Model
Easier, staticRooftop SizeRooftop Aspect
Rooftop SlopeSlide29
Anlaysis of 3D Urban Model
More Difficult, temporal in natureRooftop ShadingRooftop InsolationSlide30
Estimating PV Production CapacitySlide31
Estimating PV Production
Quantities of Suitable Rooftop AreasPV Module Performance DataInput from local PV contractors
Advice from renewable energy experts at Black & VeatchSlide32
References
“2000-2005 Lower Puget Sound Projects”. Puget Sound LiDAR Consortium. Retrieved May 3, 2010. From http://pugetsoundlidar.ess.washington.edu/lidardata/restricted/projects/2000-05lowerpugetsound.html
"Development of Renewable Energy Sources in Germany 2009". Federal Ministry for Environment, Nature Conservation and Nuclear Safety. http://www.erneuerbare-energien.de/files/pdfs/allgemein/application/pdf/ee_in_deutschland_graf_tab_2009_en.pdf.
“Fuel Mix: How Seattle City Light electricity is generated”. Seattle City Light. Retrieved May 3, 2010. From http://www.cityofseattle.net/light/FuelMix/
“Impacts of Climate Change on Washington’s Economy: A Preliminary Assessment of Risks and Opportunities”. 2006. Washington Economic Steering Committee and the Climate Leadership Initiative Institute for a Sustainable Environment. Written for State of Washington Department of Ecology and Department of Community, Trade, and Economic Development. Retrieved June 5, 2010. From http://www.ecy.wa.gov/pubs/0701010.pdf
“LiDAR Basics”. Ohio Department of Transportation. Retrieved Juen 14, 2010. From http://www.dot.state.oh.us/Divisions/ProdMgt/Aerial/Pages/LiDARBasicS.aspx
“State Electricity Profiles” U.S. Energy Information Administration Independent Statistics and Analysis. Retrieved May 3, 2010. From http://www.eia.doe.gov/electricity/st_profiles/e_profiles_sum.html
Vu, et al. 2009. Multi-scale Solution for Building Extraction from LiDAR and Image Data.
G. Zhou, et al. 2003. Urban 3D GIS from LiDAR and Digital Aerial Images. Computers & Geosciences 30 (2004) 345-353.
Q.-Y. Zhou and U. Neumann. 2008. Fast and Extensible Building Modeling from Airborne LiDAR Data. Retrieved May 3, 2010. From http://graphics.usc.edu/~qianyizh/papers/modeling_gis.pdfSlide33
Questions