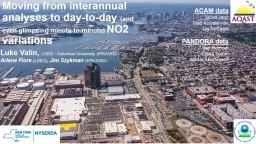
interannual analyses to daytoday and even glimpsing minutetominute NO2 variations Luke Valin LDEO Columbia University EPAORD Arlene Fiore LDEO Jim Szykman EPAORD ID: 542350
Download Presentation The PPT/PDF document "Moving from" is the property of its rightful owner. Permission is granted to download and print the materials on this web site for personal, non-commercial use only, and to display it on your personal computer provided you do not modify the materials and that you retain all copyright notices contained in the materials. By downloading content from our website, you accept the terms of this agreement.
Slide1
Moving from
interannual analyses to day-to-day (and even glimpsing minute-to-minute) NO2 variations
Luke Valin,
LDEO - Columbia University, EPA/ORDArlene Fiore (LDEO), Jim Szykman (EPA/ORD)
ACAM data
Scott
Janz
Matt
Kowalewski
Jay Al-
Saadi
PANDORA data
Jay Herman
Elena
Spinei
Nadar
AbuhassanSlide2
Long-term averages provide detailed information on the spatial
pattern of NOX emission sources
.
OMI NO2 Column - 1:30 PM daily measurement June- August; 2005 – 2012; N ≈ 150 cloud-free measurements per siteSlide3
OMI Monthly NO2 Columns (×10
15 mol. cm-2) East U.S.
(36 – 40°N; 70 – 75°W)
Lamsal et al., 2015 Monthly, regional-averaged NO2 columns observed by Aura/OMI are 1) consistent year to year (high precision) + trend 2) in agreement with trends observed at the surface
E.g., Lamsal et al., 2015; Duncan et al., 2013; Russell et al., 2010
See airquality.gsfc.nasa.gov for trends near you Slide4
Tuesday, 29 Jul 2008
Jun-Aug 2005-2012Due-West Winds
(u>0; |v
|<1 m s-1)N=38 cloud-free measurements Ameren Missouri-Labadie Plant, Labadie, MO~50 km west of central St. LouisNEI2011: 52nd largest point source of NOX (9891 tons / yr)
~ 1.7×10¹⁵
molecules cm-2
Application: Can
OMI measure the influence of power plants on NO
2
in my city
?
σ
(N=1)
=
1.0×10
15
molecules cm
-2
σ
(N=38)
=
0.16×10
15
molecules cm
-2
No
Yes
Slide5
Tuesday, 29 Jul 2008
Jun-Aug 2005-2012Due-West Winds
(u>0; |v
|<1 m s-1)N=38 cloud-free measurements Ameren Missouri-Labadie Plant, Labadie, MO~50 km west of central St. LouisNEI2011: 52nd largest point source of NOX (9891 tons / yr)
~ 1.7×10¹⁵
molecules cm-2
Can OMI measure the influence of power plants on NO
2
in my city
?
σ
(N=1)
=
1.0×10
15
molecules cm
-2
σ
(N=38)
=
0.16×10
15
molecules cm
-2
Will increase for TEMPO:
variation will not be averaged over as large of footprint
Will decrease for TEMPO:
~100x increase in N
Slide6
There is incredibly
detailed information on daily variation E.g., OMI NO2 columns over NYC
Stagnant conditionsSW winds
Strong NW windsNE winds
SSE winds
Wed., 20 July 2011
Thur., 25 Aug 2005
Wed., 8 June 2005
Tue., 26 July 2005
Sat., 23 July 2007Slide7
NOx
Emission NO
2 Columns
NOx removal+NO3 PM
Ozone productionVOC, oxidant chemistry
13 km hr
-1
Wednesday 20 July 2011
NO2 column provides information on precursor emissions and transport:
Poughkeepsie O3 at
3
PM - 120 ppb, NYC ~ 60 ppb
-- Identify high priority data segments (geographic, spectral) necessary to generate near real time NO2 products for use in statistical or dynamical O3 forecast modelsSlide8
Ozone production (P
O3) depends on 1) NOx
2) VOC (correlated with temperature)
More VOCBiogenic VOC ~ Temperature
What information can currently available measurements of NO2 columns provide on surface O3 exposure?
Slide9
NYC
– stagnant winds, large NO2 columns, Hot temperatures:
slow net P
O3 in NYC, fast PO3 at edge6 km hr-1T1PM = 31° CSlide10
3 km hr
-1T1PM = 28° C
NYC
– stagnant winds, intermediate NO2 columns, warm temperatures: very fast local PO3Slide11
4 km hr
-1T1PM=19° C
NYC
– stagnant winds, large NO2 columns, cold temperatures: slow local PO3, net local O3 destructionSlide12
DISCOVER-AQ: Initial glimpses at the monitoring network of the futureSlide13
ACAM (“TEMPO flight simulator”) Bakersfield, January 2013
Bakersfield
Bakersfield
BakersfieldData courtesy of NASA-GSFC (S. Janz) WindMorning
Mid-dayAfternoon
SW transport of high NO2 over Bakersfield site between morning and mid-day with steep gradients (~0 – 2×10¹⁶
molecule cm-2)Slide14
P3B integrated spirals
PANDORA NO2Surface NO2
(scaled)
PANDORA NO2 columns (●) and integrated P3B NO2 profiles (
▼) are consistent with ACAM slant NO2 observations.The relationship of column (
●) and surface NO2 ( —
, scaled) highlights impacts of boundary layer growth.Data courtesy of USEPA (R. Long
), NCAR (A.
Weinheimer
)
and
NASA‑GSFC
(J. Herman) Slide15
Morning
Mid-day
Afternoon
BakersfieldBakersfieldBakersfieldData courtesy of NASA-GSFC (S. Janz) Wind
Bakersfield
Bakersfield
BakersfieldCMAQv5.1/4km
CMAQv5.1/4KM does not capture spatial variation
-- NO2 columns provide extremely detailed information on pollutant transport
-- Need to combine chemical and met reanalysis?
Courtesy of EPA/NERL/CEDSlide16
Highlights the limitations of evaluating model performance using surface data alone (top), particularly in conditions where mixing (or lack of mixing) are difficult to simulate
Simulated
Observed
SimulatedObservedSlide17
ACAM NO2 Column
10 – 10:15 AMP3B
in situ NO2 spiral scaled to column (ppbx3e15) 10 – 10:15 AM
~30 minute NO2 column enhancementobserved by PANDORA over Essex at 10:15 AMACAM NOx Emission/transport monitoring capabilities can go down to minute-to-minute time scale.Essex, MD, DAQ-MarylandTuesday, 5 July 2011A data-driven phonebook? Local AQ managers are provided an automated list of potentially relevant stakeholders based on TEMPO measurements
Essex site
Essex siteSlide18
Conclusions Air quality managers want information on causes of exceedance events - daily variations, local scales
See aqast.wisc.edu for AQAST engagement of AQ managers with current resources on East US pollution episodesDISCOVER-AQ ground and satellite simulator resources provide an initial glimpse of monitoring network of future - column, surface and model needs
Met reanalysis/forecast systems are not optimized for scales of observations that will be available
Slide19
Recommendations to data providers
Include measurements and expected values of well understood species (e.g., O4 column, O2 column, Ring “column”) in trace gas level 2 and 3 products.Identify high priority data segments for faster response forecasting needs.Compute column quantities of NO2 and HCHO (including loss and production terms) as standard suite of model resultsSlide20
ExtrasSlide21
Local Standard Time
PANDORA NO2 columnEPA CAPS NO2
Data courtesy of USEPA (R. Long) and NASA-GSFC (J. Herman)
DISCOVER-AQ HoustonWhat is the relationship between surface exposure and column concentrations?Slide22
What is the relationship of NO2 column (molecules cm
2) to NOX emissions (tons / day)? Labadie PP:
27 tons/day * (2000 lbs/tons) / (2.2 lbs/kg) / (0.044 kg/mole) * (6.02e23 molecules/mole) / (1e10 cm^2/ km^2) / (24 hours/day) /
(50x50 km^2) * (4 hour lifetime) *0.75 NO2:NOx~ 1.7 × 10¹⁵ molecules cm2 OMI daily measurement 1σ Noise: ~ 1× 10¹⁵ molecules cm
2 Slide23
2008
NASA Standard Product vs INTEX-B NO2Slope: 0.86Y-intercept: 0.14 × 10
16 cm-2
DOMINO vs INTEX-B NO2Slope: 1.68Y-intercept: -0.59 × 1016 cm-2OMI NASA-SP and DOMINO Validation:One possible stakeholder takeaway: Factor of 2 “uncertainty”Slide24
Bucsela et al., 2013 ( panel
c – latest version)Slide25
Russell et al., 2011 (
before SP and DOMINO updates)