/
Retail Equity Research Retail Equity Research

Retail Equity Research - PDF document

pamella-moone
pamella-moone . @pamella-moone
Follow
405 views
Uploaded On 2016-12-06

Retail Equity Research - PPT Presentation

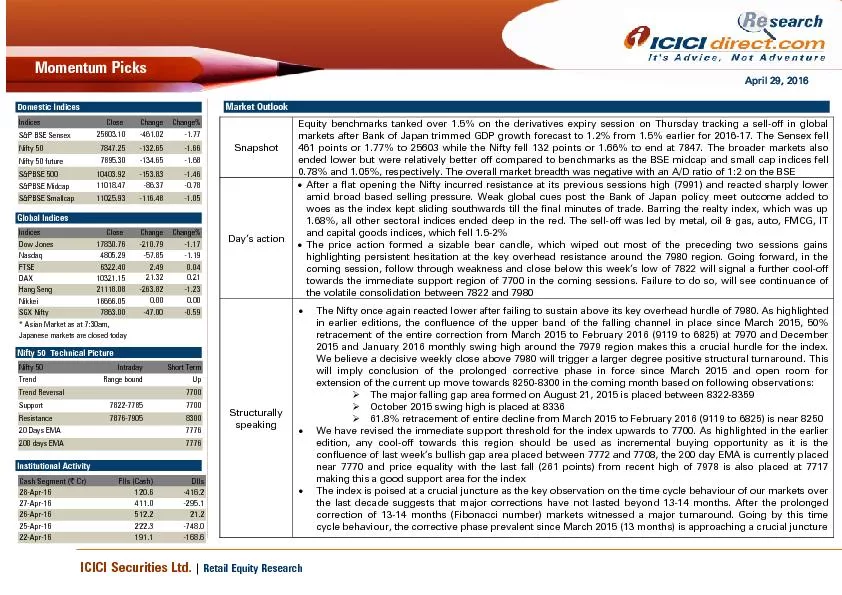
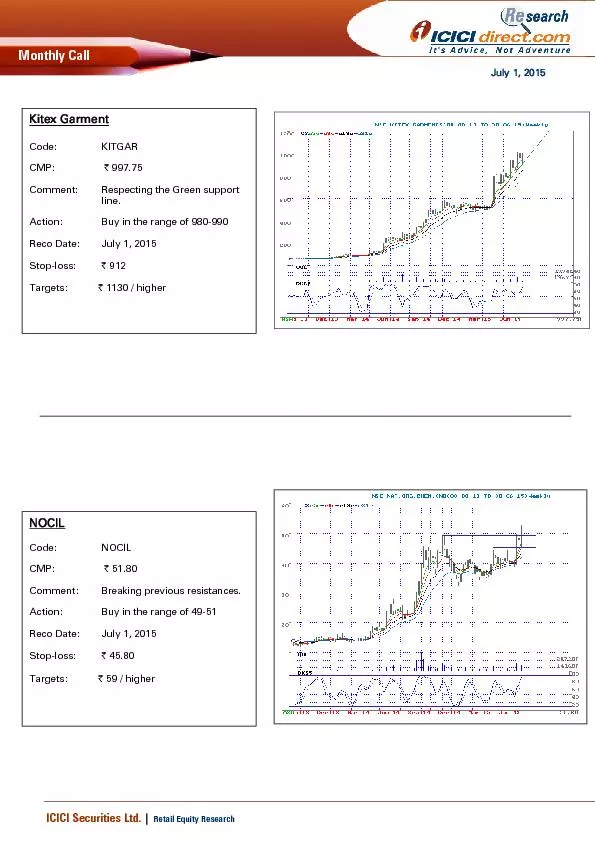
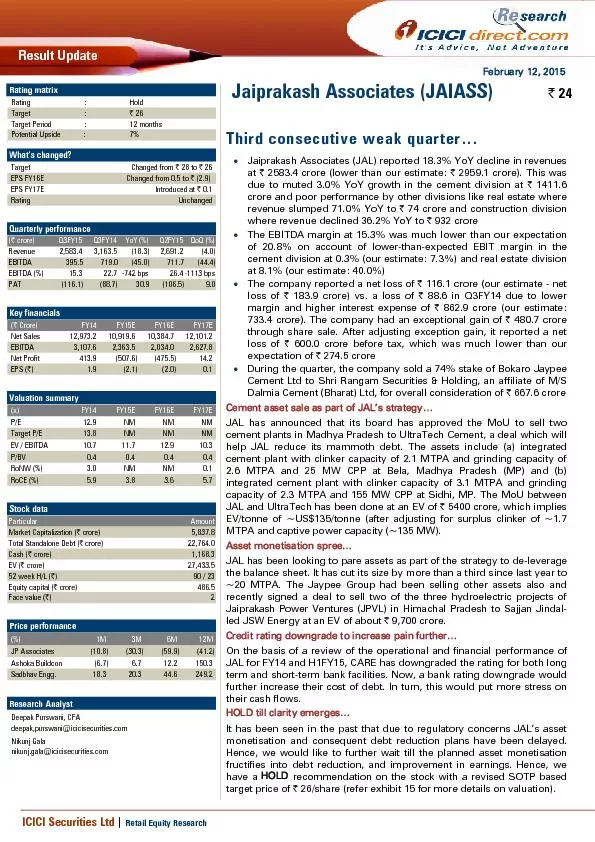
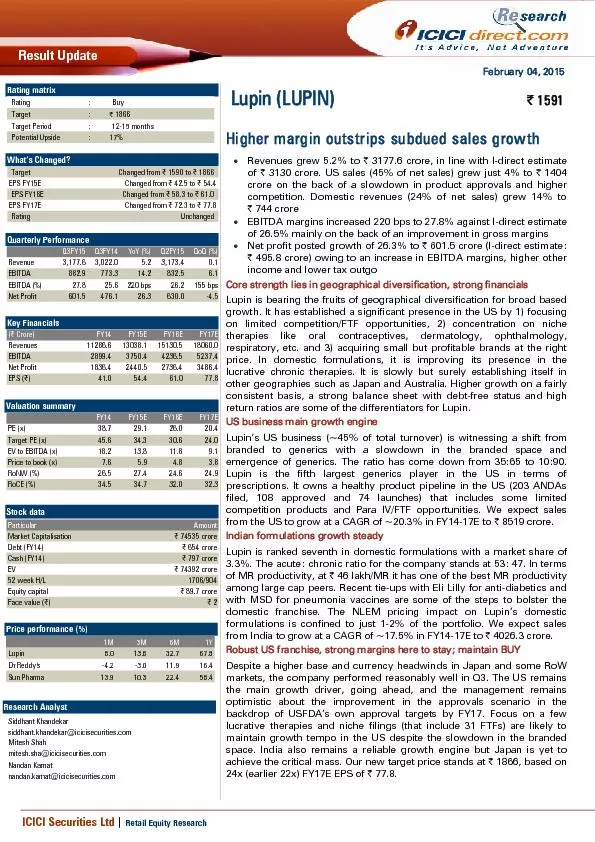
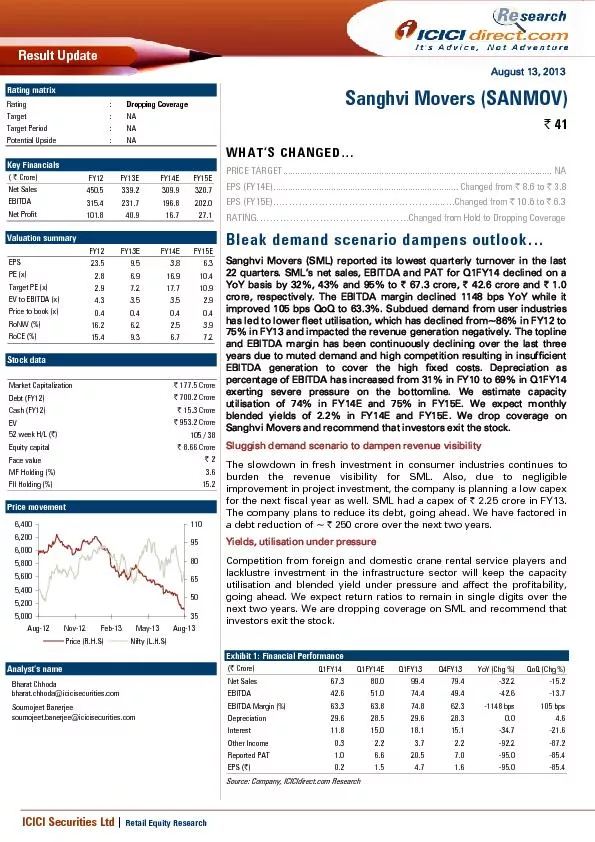
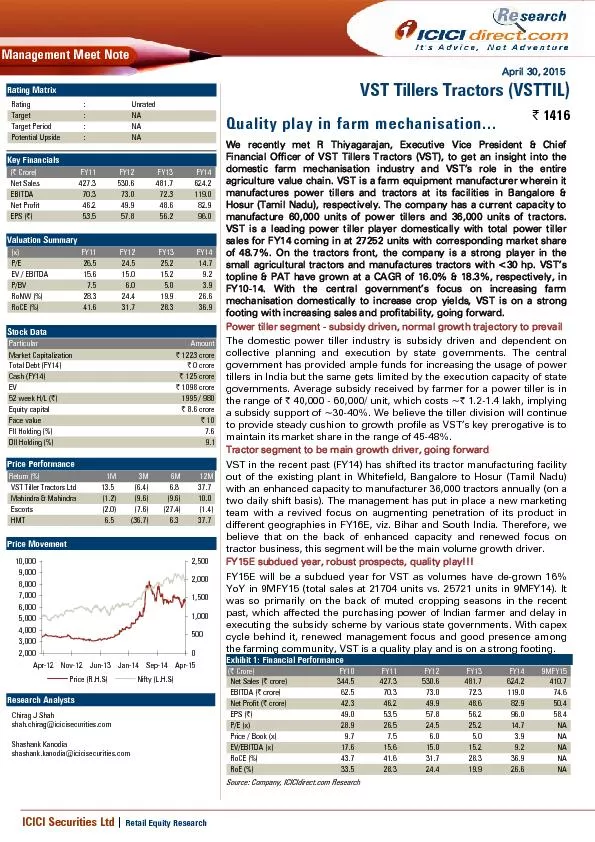
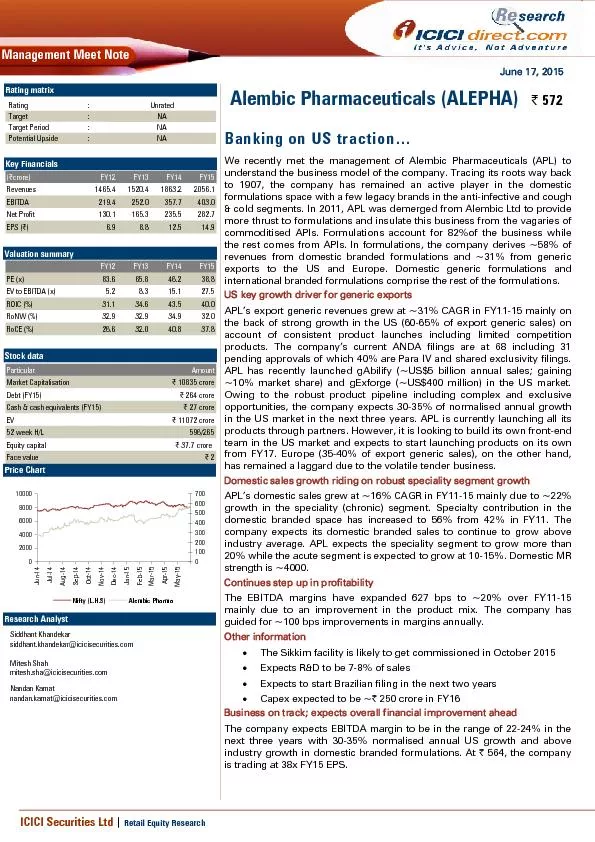
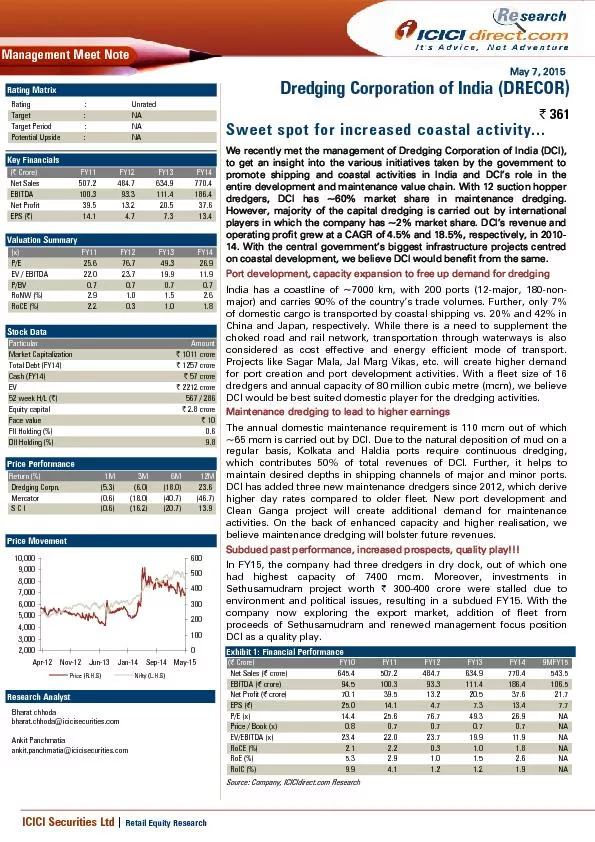
September 7 2015 Management Meet Note We met the management of Eros International to get a deeper insight into the growth triggers that would favour the company in coming years Eros producerdistr ID: 498242

September 2015 Management Meet Note

Share:

Link:

Embed:

Download Presentation from below link

Download Pdf The PPT/PDF document "Retail Equity Research" is the property of its rightful owner. Permission is granted to download and print the materials on this web site for personal, non-commercial use only, and to display it on your personal computer provided you do not modify the materials and that you retain all copyright notices contained in the materials. By downloading content from our website, you accept the terms of this agreement.


Presentation Transcript

September 7, 2015 Retail Equity Research Management Meet Note We met the management of Eros International to get a deeper insight into the growth triggers that would favour the company in coming years. Eros, producer/distributor with a large film library of over 2000 films, is a force to reckon with in the Indian film exhibition and production space. The company is actively working towards making its content available across different platforms to combat the divergence of audiences towards digital platforms. Eros has entered into partnerships with three Chinese film companies to explore joint opportunities in China. In addition, it has also launched Trinity Pictures to focus on franchise films. The parent company had recently launched the official marketing campaign for its digital platform Eros now, which already has 26.5 million registered users. The domestic company would provide content to Eros Now at an arms length transfer pricing. The company will soon make disclosures with regards to the deal between the domestic and parent company that will help us gauge the incremental revenue potential from Eros Now and be comforting to its investors. With stellar Q1 results and a better-than-expected box-office performance in Q2, the robustness in FY16E numbers is already visible. We continue to maintain rating valuing Eros at 16.0x FY17E EPS to arrive at a target price of | 612. De-risked business, diversifying content delivery platformsEros generally recovers whole production cost even before theatrical release in the form of sale of music rights, satellite rights and 39% guaranteed cost recovery from its parent for international distribution. In addition, monetisation of huge movie library over pay TV, innovative box office performance linked satellite rights and preview over premium TV (HBO Defined, HBO Hits) will further reduce its dependence on theatrical revenue. Moreover, as Eros Now that already has a subscriber base of 26 million, picks up further, we would see incremental revenues from the same. We expect collective revenues from other segments to grow at 24.2% CAGR in FY15-17 to | 686.4 crore in FY17E, forming 35.2% of overall revenue. However, we have not included revenue from HBO channels in our estimates. Heavy content pipeline ahead…. languages, of which seven were high budget movies. Though the whole of FY15 was relatively weak for the movie industry, Eros managed to grow box office collections (domestic and overseas) by ~27%. Bhaijaan has already stolen the show by being one of the highest grossers for the company. Going ahead, with a robust pipeline of films Singh is BlingBajirao Mastani and strong regional portfolio the year is expected to be a stellar one for Eros. We expect theatrical revenues (inclusive of overseas) to grow at 13.8% CAGR in FY15-17E to | 1265.1 crore in FY17E Maintain BUY with target price of 612…. Coupled with its strong footing in India, Eros also enjoys a competitive advantage in terms of strong international presence owing to its parent company Eros PLC. We derive comfort from the management’s intent on clarifying the transfer pricing deal with the parent, going ahead, which would be a boost to investor confidence and transparency. The consolidated revenue and PAT is expected to grow at of CAGR of 17.2% and 19.7%, respectively, in FY15-17E. We continue to maintain BUY rating valuing it at 16.0x FY17E EPS to arrive at a target price of | 612. Eros International (EROINT) Rating matrix Rating:BuyTarget:| 612Target Period:12 monthsPotential Upside:27% What’s changed? TargetUnchangedEPS FY16EUnchangedEPS FY17EUnchangedRatingUnchanged Key financials | CroreFY14FY15FY16EFY17ENet Sales 1,135 1,421 1,678 EBITDA 300 349 432 532 Net Profit 200 247 292 354 EPS (|) 21.7 26.7 31.6 38.2 Valuation summary FY14FY15FY16EFY17EP/E 22.118.015.212.6Target P/E 28.2 22.9 19.4 16.0 EV / EBITDA15.613.511.49.6 3.7 3.0 2.5 2.1 RoNW16.516.716.716.8RoCE 16.6 16.7 17.2 17.2 Stock data ParticularAmountMarket Capitalization (| Crore) 4,440.5 Total Debt (FY15) (| Crore) 425.0 Cash (FY15) (| Crore) 169.7 EV 4,695.8 52 week H/L 634 / 236 Equity capital 92.5 Face value 10.0 Price Chart 6,5007,0007,5008,0008,5009,0009,500100200300400500600700Sep-15Jun-15 -15Dec-14Sep-14 Price (R.H.S) Nifty (L.H.S) Research Analysts Bhupendra Tiwary bhupendra.tiwary@icicisecurities.com Sneha Agarwal sneha.agarwal@icicisecurities.com Retail Equity Research Financial summary Profit and loss statement | Crore (Year-end March)FY14FY15FY16EFY17ETotal operating Income1,134.71,421.21,678.31,951.5Growth (%)6.225.218.116.3Operating Expenses767.41,072.91,011.91,282.9Employee Expenses28.235.9 44.658.5Administrative Expenses33.596.7 58.378.1Change in inventory& Other exp.5.8 (132.9) 131.9 - Total Operating Expenditure834.91,072.61,246.71,419.5EBITDA299.8348.6431.6532.0Growth (%)32.516.323.823.3Depreciation5.06.96.36.6Interest32.738.436.961.9Other Income5.019.920.116.0PBT267.0323.2408.4479.6Total Tax73.776.2104.6123.0Minority Interest(6.4) (0.1) 11.9 2.9 PAT199.7247.1291.9353.8Growth (%)29.323.718.221.2EPS (|)21.726.731.638.2 Source: Company, ICICIdirect.com Research Cash flow statement | Crore (Year-end March)FY14FY15FY16EFY17EProfit after Tax199.7247.1291.9353.8Add: Depreciation & Amortization5.06.96.36.6Add: Interest Paid32.738.436.961.9(Inc)/dec in Current Assets-30.0-502.3135.9-45.2Inc/(dec) in CL and Provisions128.4709.2140.1202.2CF from operating activities335.9499.3611.1579.3(Inc)/dec in Fixed Asset-393.8-619.4-800.0-700.0Others51.0105.511.92.9CF from investing activities -342.8-513.9-788.1-697.1Issue/(Buy back) of Equity0.00.50.00.0Inc/(dec) in loan funds-0.941.8150.0200.0Dividend & dividend tax- - - Interest Paid32.738.436.961.9Others-10.4-12.4-62.9-61.9CF from financing activities-11.229.987.1138.1Net Cash flow-18.115.3-89.920.2Opening Cash172.5154.4169.779.7Closing Cash154.4169.779.7100.0 Source: Company, ICICIdirect.com Research Balance sheet | Crore (Year-end March)FY14FY15FY16EFY17ELiabilitiesEquity Capital92.092.592.592.5ESOP's- - - - Reserve and Surplus1,116.71,389.71,655.62,009.4Total Shareholders funds1,208.61,482.21,748.12,101.9Total Debt383.2425.0575.0775.0Other Non Current Liabilities208.6259.2271.1274.0Total Liabilities1,800.42,166.42,594.23,150.9AssetsGross Block2,909.33,113.64,112.44,971.4Less: Acc Depreciation1,868.51,875.41,881.71,888.2Net Block1,040.81,238.22,230.73,083.2Capital WIP578.9994.1795.2636.2Total Fixed Assets1,619.72,232.23,025.93,719.4Investments8.00.00.00.0Inventory4.0136.9145.5148.1Debtors205.3525.7344.9374.3Loans and Advances146.1184.0217.2227.3Other Current Assets5.316.319.422.6Cash154.4169.779.7100.0Total Current Assets515.01,032.6806.8872.2Creditors365.51,081.11,218.51,416.9Provisions27.521.123.827.7Total Current Liabilities393.01,102.21,242.31,444.5Net Current Assets122.0-69.6-435.5-572.3Other Non Current Assets50.73.83.83.8Application of Funds1,800.42,166.42,594.23,150.9 Source: Company, ICICIdirect.com Research Key ratios (Year-end March)FY14FY15FY16EFY17EPer share data (|)EPS21.726.731.638.2Cash EPS22.327.532.239.0 V 131.4160.2189.0227.2DPS0.00.00.00.0Cash Per Share16.818.38.610.8Operating Ratios (%)EBITDA Margin26.424.525.727.3EBIT / Total Operating income26.024.025.326.9PAT Margin17.617.417.418.1Inventory days1.335.231.627.7Debtor days66.0135.075.070.0Creditor days117.6277.7265.0265.0Return Ratios (%)RoE16.516.716.716.8RoCE16.616.717.217.2RoIC29.034.224.821.8 aluation Ratios (x)P/E22.118.015.212.6EV / EBITDA15.613.511.49.6EV / Net Sales4.13.32.92.6Market Cap / Sales3.93.12.62.3Price to Book Value3.73.02.52.1Solvency RatiosDebt/EBITDA1.31.21.31.5Debt / Equity0.30.30.30.4Current Ratio0.90.80.60.5Quick Ratio0.90.70.50.4 Source: Company, ICICIdirect.com Research Retail Equity Research ICICIdirect.com endeavours to provide objective opinions and recommendations. ICICIdirect.com assigns ratings to its stocks according to their notional target price vs. current market price and then categorises them as Strong Buy, Buy, Hold and Sell. The performance horizon is two years unless specified and the notional target price is defined as the analysts' valuation for a stock. Strong Buy:� 15%/20% for large caps/midcaps, respectively, with high conviction; �Buy: 10%/15% for large caps/midcaps, respectively; Head – Researchpankaj.pandey@icicisecurities.comICICIdirect.com Research Desk, ICICI Securities Limited, Road No 7, MIDC, Mumbai – 400 093 research@icicidirect.com Retail Equity Research ANALYST CERTIFICATION We /I, Bhupendra Tiwary MBA, Sneha Agarwal, MBA Research Analysts, authors and the names subscribed to this report, hereby certify that all of the views expressed in this research report accurately reflect our views about the subject issuer(s) or securities. We also certify that no part of our compensation was, is, or will be directly or indirectly related to the specific recommendation(s) or view(s) in this report. Terms & conditions and other disclosures: ICICI Securities Limited is a Sebi registered Research Analyst having registration no. INH000000990. ICICI Securities Limited (ICICI Securities) is a full-service, integrated investment banking and is, inter alia, engaged in the business of stock brokering and distribution of financial products. ICICI Securities is a wholly-owned subsidiary of ICICI Bank which is India’s largest private sector bank and has its various subsidiaries engaged in businesses of housing finance, asset management, life insurance, general insurance, venture capital fund management, etc. (“associates”), the details in respect of which are icicibank.com. ICICI Securities is one of the leading merchant bankers/ underwriters of securities and participate in virtually all securities trading markets in India. We and our associates might have investment banking and other business relationship with a significant percentage of companies covered by our Investment Research Department. ICICI Securities generally prohibits its analysts, persons reporting to analysts and their relatives from maintaining a financial interest in the securities or derivatives of any companies that the analysts cover. The information and opinions in this report have been prepared by ICICI Securities and are subject to change without any notice. The report and information contained herein is strictly confidential and meant solely for the selected recipient and may not be altered in any way, transmitted to, copied or distributed, in part or in whole, to any other person or to the media or reproduced in any form, without prior written consent of ICICI Securities. While we would endeavour to update the information herein on a reasonable basis, ICICI Securitiesis is under no obligation to update or keep the information current. Also, there may be regulatory, compliance or other reasons that may prevent ICICI Securities from doing so. Non-rated securities indicate that rating on a particular security has been suspended temporarily and such suspension is in compliance with applicable regulations and/or ICICI Securities policies, in circumstances where ICICI Securities might be acting in an advisory capacity to this company, or in certain other circumstances. This report is based on information obtained from public sources and sources believed to be reliable, but no independent verification has been made nor is its accuracy or completeness guaranteed. This informational purpose and shall not be used or considered as an offer document or solicitation of offer to buy or sell or subscribe for securities or other financial instruments. Though disseminated to all the customers simultaneously, not all customers may receive this report at the same time. ICICI Securities will not treat recipients as customers by virtue of their receiving this report. Nothing in this report constitutes investment, legal, accounting and tax advice or a representation that any investment or strategy is suitable or appropriate to your specific circumstances. The securities discussed and opinions expressed in this report may not be suitable for all investors, who must make their own investment decisions, based on their own investment objectives, financial positions and needs of specific recipient. This may not be taken in substitution for the exercise of independent judgment by any recipient. The recipient should independently evaluate the investment risks. The value and return on investment may vary because of changes in interest rates, foreign exchange rates or any other reason. ICICI Securities accepts no liabilities whatsoever for any loss or damage of any kind arising out of the use of this report. Past performance is not necessarily a guide to future performance. Investors are advised to see Risk Disclosure Document to understand the risks associated before investing in the securities markets. Actual results may differ materially from those set forth in projections. Forward-looking statements are not predictions and may be subject to change without notice. ICICI Securities or its associates might have managed or co-managed public offering of securities for the subject company or might have been mandated by the subject company for any other assignment in the past twelve months. ICICI Securities or its associates might have received any compensation from the companies mentioned in the report during the period preceding twelve months from the date of this report for services in respect of managing or co-managing public offerings, corporate finance, investment banking or merchant banking, brokerage servmerger or specific transaction. ICICI Securities or its associates might have received any compensation for products or services other than investment banking or merchant banking or brokerage services from the companies mentioned in the report in the past twelve months. ICICI Securities encourages independence in research report preparation and strives to minimize conflict in preparation of research report. ICICI Securities or its analysts did not receive any compensation or other benefits from the companies mentioned in the report or third party in connection with preparation of the research report. Accordingly, neither ICICI Securities nor Research Analysts have any material conflict of interest at the time of publication of this report. It is confirmed that Bhupendra Tiwary MBA, Sneha Agarwal, MBA, Research Analysts of this report have not received any compensation from the companies mentioned in the report in the preceding twelve months. Compensation of our Research Analysts is not based on any specific merchant banking, investment banking or brokerage service trICICI Securities or its subsidiaries collectively or Research Analysts do not own 1% or more of the equity securities of the Company mentioned in the report as of the last day of the month preceding the publication of the research report. Since associates of ICICI Securities are engaged in various financial service businesses, they might have financial interests or beneficial ownership in various companies including the subject company/companies mentioned in this report. It is confirmed that Bhupendra Tiwary MBA, MBA Sneha Agarwal, MBA, Research Analysts do not serve as an officer, director or employee of the companies mentioned in the report. ICICI Securities may have issued other reports that are inconsistent with and reach different conclusion from the information presented in this report. Neither the Research Analysts nor ICICI Securities have been engaged in market making activity for the companies mentioned in the report. We submit that no material disciplinary action has been taken on ICICI Securities by any Regulatory Authority impacting Equity Research Analysis activities. This report is not directed or intended for distribution to, or use by, any person or entity who is a citizen or resident of or located in any locality, state, country or other jurisdiction, where such distribution, publication, availability or use would be contrary to law, regulation or which would subject ICICI Securities and affiliates to any registration or licensing requirement within such jurisdiction. The securities described herein may or may not be eligible for sale in all jurisdictions or to certain category of investors. Persons in whose possession this document may come are required to inform themselves of and to observe such restriction.