PDF-Unit 6: Standard Deviation | Student Guide | Page 1
Unit 6 Standard Deviation Summary of Video
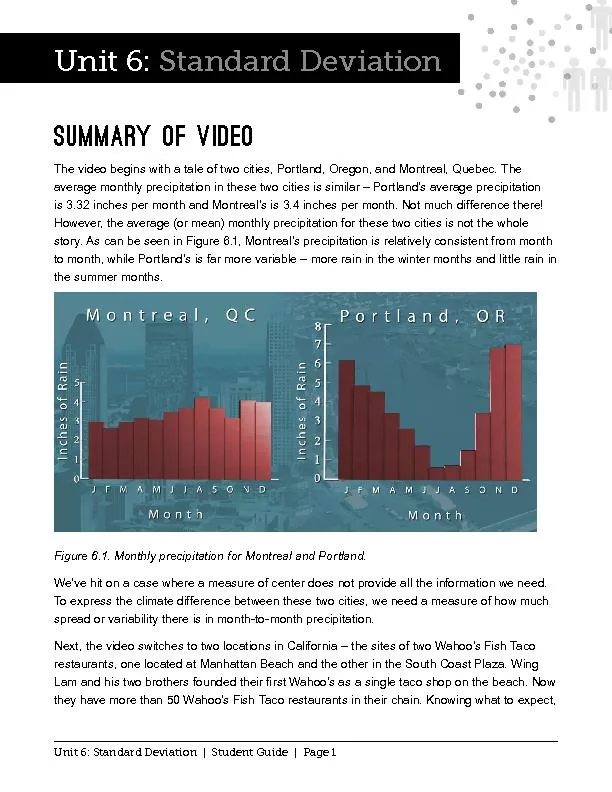
The video begins with a tale of two cities Portland Oregon and Montreal Quebec The average monthly precipitation in these
Download Presentation
"Unit 6: Standard Deviation | Student Guide | Page 1" is the property of its rightful owner. Permission is granted to download and print materials on this website for personal, non-commercial use only, provided you retain all copyright notices. By downloading content from our website, you accept the terms of this agreement.
Presentation Transcript
Transcript not available.