/
Regulation of Gene Expression Regulation of Gene Expression

Regulation of Gene Expression - PowerPoint Presentation

pasty-toler
pasty-toler . @pasty-toler
Follow
453 views
Uploaded On 2018-01-05

Regulation of Gene Expression - PPT Presentation

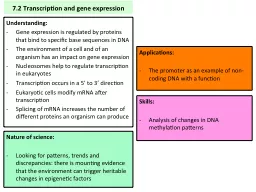
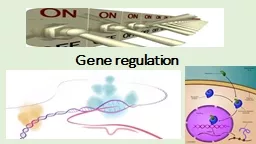
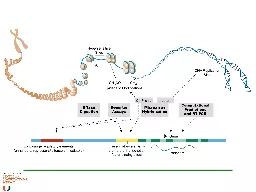
Pretranscriptional regulation chromatin compaction eg deacetylation methylation transcriptional initiation ie transcription factors to activate or repress alternative promoters ID: 619884

tss promoter gene transcription promoter tss transcription gene tfbss promoters initiation exon tsss time multiple analysis alternative regulation site

Share:

Link:

Embed:

Download Presentation from below link

Download Presentation The PPT/PDF document "Regulation of Gene Expression" is the property of its rightful owner. Permission is granted to download and print the materials on this web site for personal, non-commercial use only, and to display it on your personal computer provided you do not modify the materials and that you retain all copyright notices contained in the materials. By downloading content from our website, you accept the terms of this agreement.


Presentation Transcript

Slide1
Slide2

Regulation of Gene Expression

Pre-transcriptional regulation

chromatin compaction

eg

deacetylation

,

methylation

transcriptional initiation

ie

transcription factors to activate or repress

alternative promoters =

?

> alternative transcripts

During transcription

number of transcripts

made, rate of transcription

alternative mRNA splicing =

?

> splice variants (alternative transcripts)

regulation of mRNA stability (3’UTR,

miRNA

etc)

Post-transcriptional regulation

5’UTR regulatory functions not yet fully understood

regulation of translation initiation

during folding of the protein

later

control of protein activity (

acetylation

, phosphorylation etc)Slide3

What is a promoter

A DNA sequence that is involved in the regulation of a gene.

It has a binding site for RNA polymerase and binding sites for transcription factors.

Was thought to be immediately upstream of a gene, but in fact is symmetrical around the transcriptional start site (ENCODE, 2007)

Activity of protein complexes bound to promoter regions can

activate a gene (switch on)

or repress its transcription (switch off)

or somewhere in between (dimmer switch) Slide4

Exon 1

Exon 2

TSS

Transcriptional Start Site

5’UTR

Translation initiation site

Initiation

codon

ATG

promoter

5’

3’

Exon 1

Exon 2

Transcription factor binding sites

TFBSsSlide5

Classifying Promoters

B

y distance from TSS

but where is the TSS

B

y signal in ATCG content (

Landolin

et al., 2013)

but does this apply in all species and cell types?

By concentration of TFBSs along the length of the gene, around the TSS or several TSSs but what if these signals are only relevant in certain tissues at certain times?Slide6

By distance from TSS

Length of a promoter varies greatly. Usually has many transcription factor binding sites along it – but spacing can be large.

BASIC CATEGORIES OF PROMOTERS

Core promoter

is the region ± 40 from the TSS;

Proximal promoter

is the region

±

250 from the TSS. Many current promoter analysis studies actually take a

promoter region which is

±

500, ± 1000 or even

± 5000 bases from the TSS. An

enhancer

is a sequence located several Kb upstream or downstream of a gene that its regulates transcription. Slide7

Transcription Factors

Activators or Repressors

and cofactors, chaperones, modifiers

Usually work in large protein complexes

Need 2-4 per promoter

Two TFs may compete for same

binding site:

e.g.

one

is repressing, needs to be modified in some way to allow an activator to bind and switch that gene on.

Regulate transcription per tissue, time, physiological state, etcSlide8

Finding TFBSs

S

equence based. Some literature reports include protein structure parameters.

Motif finding algorithms abound.

Start with a multiple sequence alignment, most are probabilistic.

PSSM

HMM

Weight array matrix with Markov dependence assumptions

Trees or Baysian networksMostly based on assumption that TFBSs are of fixed length

Non-probabilistic models allow variable length through degeneracy

Exon 1

Exon 2

CTGTCCAGAACT

ATGCGGGTACT

GTATCTTAGTSlide9

Defining TFBSs

a

G

g t a c

T

t

C

c

A

t a

A

g t

Alignment

a c g t

T A

g t a c g t C c

A

t C

c g t a c g G _________________

A

3 0 1

0 3 2 1

0

Profile C

2 4 0 0

1 3 0 0

G 0

1 4 0 0 0

3 1

T 0 0 0 5 1

0 1

4

_________________

Consensus

A C G T A C G T

Regular expression [A/C] C G T N [A/C] {C} TSlide10

Representing TFBSs

If very conserved, easy to define a motif

Consensus or regular expression

Graphical representation (logo)

Frequency countsSlide11

Confirming TFBSs

Found a motif, now search it against TFBS databases

CHIP-

seq

experimental evidence

Chromatin accessibility

Found a TFBS… stimulus, time

, tissue?SP1, PAX9, HNF1 alphaSlide12

It’s Complicated

Sequence analysis might find several on a promoter

When, where, how…

Include activators and repressors

For shorter TFBSs, lots of false positives

Modules of 3 or 4 work together to regulate the transcription of a gene.

Exon 1

Exon 2Slide13

Prediction of promoter regions

Closely linked to prediction of ORFs

where there is an ORF there is a

promoter (? TATA box)

Two main methods:

- Pattern Driven

a

concentration of TFBSs

- Conservation Across Species conserved TFBS patterns

Problems with both:

TFBSs are only 5-15bp long, and can be variable vary between species, and relevance to tissues

methods say nothing about context of the sites, interactions between TFs, or probability that a site is functionalSlide14

Eukaryotic Promoter Database

A collection

of experimentally verified TSSs and the promoter regions associated with them.

>When it began

Experimental

evidence,

one gene at a time. Results

using the techniques of the time found that each

gene had one

TSS and one promoter, upstream of TSS.

>NowMore sophisticated techniques and high

-throughput methods, one genome at a time (

e.g. 5’ESTs). A gene can have multiple TSSs, multiple promoters, symmetrical around TSS>HowPartly experimental, partly computational.

Recognises

promoters by presence of “promoter elements” (TATA boxes, CpG islands, etc)Slide15

EPD: Three classes of promoters

(with experimental evidence)

Single initiation sites (genes with one TSS)

2. Clustered multiple initiation sites (genes with several TSSs close together)

3. Transcriptional initiation regions (several TSSs far apart)

These genes may have alternative promotersSlide16

Which one is it?

Experimental methods for finding TSSs rely on specialized sequencing of 5’ end of full length clones

Multiple TSSs are always found per gene, which one is the “real” one? Depends on

tissue and time, physiological state, stimulus,

etc

For your research, do

you:

Take the

TSS farthest 5’end from the ATG (translation initiation codon)

o

r

the TSS most frequently found before the ATG?

Or see if both apply, and assign multiple TSSs and promoters accordingly? EPD and DBTSS both can help you do thatSlide17

Web Tools for Promoter Analysis

Lots of promoter analysis web tools out there- check date last modified and/or updated, read the paper, test it out, try out more than one.

Many need a multiple alignment of promoter regions as input.

Remember possibility of alternative promoters.

Following slides are a couple of good databases and several tools.Slide18

Eukaryotic Promoter DatabaseSlide19
Slide20
Slide21
Slide22
Slide23

Melina II uses four different pattern searching algorithms for promoter analysisSlide24

Promoter Analysis Project Example

Best strategy is to conduct a pattern finding search (use more than one web tool for this), followed by conservation analysis across comparable species to identify possible active TFBSs.

Chr Prot(aa) nuclear cytoplasmic

HDAC11 3p25.1 347

  

HDAC1 1p34.1 482

 

HDAC2 6q21 488

 

HDAC3 5q31.2 428

  

HDAC8 Xq13 377

HDAC4 2q37.2 1084

 

HDAC5 17q21 1122

 

HDAC7 12q13.1 952

 HDAC9 7p21.1 1011  

HDAC6 Xp11.23 1215

  

HDAC10 22q13.31 669

  Slide25

Predicted motifs on 2000bp region of HDACs

. The region

500bp upstream and 100bp downstream of TSS, contains more than half of predicted motif species.Slide26

The conserved motifs among mammals were identified by footprint. The pattern of conserved

motifs is distinct

in different species groups.

(Z. Jiang and S. Khuri using

Genomatix

software suite)Slide27

The predicted motifs on HDAC1 were grouped by tissue specificity feature. The motifs we found point to transcription factors that have some tissue and time preferences, which implies distinct expression patterns among the HDACs.