PPT-Figure 4:
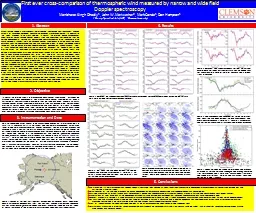
Temporal and spatial evolution of horizontal wind field on 11 February 2010 estimated by SDI monostatic blue and FPI bistatic without vertical wind correction red
Download Presentation
"Figure 4:" is the property of its rightful owner. Permission is granted to download and print materials on this website for personal, non-commercial use only, provided you retain all copyright notices. By downloading content from our website, you accept the terms of this agreement.
Presentation Transcript
Transcript not available.