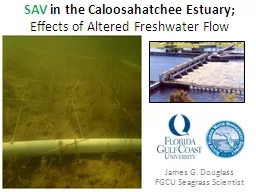
/
SAV  in the Caloosahatchee Estuary; SAV  in the Caloosahatchee Estuary;

SAV in the Caloosahatchee Estuary; - PowerPoint Presentation

phoebe-click
phoebe-click . @phoebe-click
Follow
408 views
Uploaded On 2016-07-29

SAV in the Caloosahatchee Estuary; - PPT Presentation

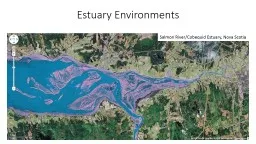
Effects of Altered Freshwater Flow James G Douglass FGCU Seagrass Scientist Estuary A semienclosed body of water where freshwater mixes with seawater Salinity SAV Submersed Aquatic Vegetation ID: 424078

estuary salinity flow sav salinity estuary sav flow water freshwater ocean variability caloosahatchee species variation environmental river conditions fresh

Share:

Link:

Embed:

Download Presentation from below link

Download Presentation The PPT/PDF document "SAV in the Caloosahatchee Estuary;" is the property of its rightful owner. Permission is granted to download and print the materials on this web site for personal, non-commercial use only, and to display it on your personal computer provided you do not modify the materials and that you retain all copyright notices contained in the materials. By downloading content from our website, you accept the terms of this agreement.


Presentation Transcript

Slide1

SAV

in the Caloosahatchee Estuary;Effects of Altered Freshwater Flow

James G. DouglassFGCU Seagrass ScientistSlide2

Estuary

A semi-enclosed body of water where freshwater mixes with seawater

SalinitySlide3

SAV = Submersed Aquatic Vegetation

True Plants that live entirely underwaterSaltwater

SAV is called seagrass

SAV

has real roots and leaves, unlike

seaweedSlide4

SAV

Affected by many aspects of the environmentIndicator of Environmental Health

Temperature

Salinity

Light

Dirt & Silt

Tannins (CDOM)

Water Movement

Nutrients

Epiphytic Algae

Animal Interactions

Phytoplankton

NutrientsSlide5

Salinity

SAV

Different species need different levels of salinity to survive.Slide6

Common Caloosahatchee SAV

Turtlegrass: Thalassia

testudiniumPrefers full salinity of oceanTolerates ~2/3 ocean salinity

Shoalgrass: Halodule wrightii

Prefers full salinity of oceanTolerates ~1/2 ocean salinityTapegrass:Vallisneria americanaPrefers freshwaterTolerates ~1/4 ocean salinitySlide7

2 Types of Environmental Variation

Spatial variation Environmental conditions vary from place to placeIncreases

species diversityTemporal variation

Environmental conditions fluctuate over timeIncreases stress

Time

Conditions

Past

Present

Low

HighSlide8

Marine Species Live Here

Freshwater Species Live Here

Spatial

Variation in an Estuary

Location in Estuary

AVERAGE

Salinity

0

35

River

Ocean

Mid Estuary

Salinity blends from fresh to salty along the estuarySlide9

Temporal Variation

in an EstuaryLocation in Estuary

RANGE of Salinity

River

OceanMid Estuary

0

Salinity naturally fluctuates due to tides, rainfall, seasons, etc.

35

Middle part of estuary usually varies the mostSlide10

Caloosahatchee River Estuary

Mostly Salty

Mixed and Variable

Mostly FreshSlide11

S-79 Dam Controls Flow to Estuary

SFWMD Scientists have determined that:

Upper estuary gets

too salty when flow is < 450 cfsLower estuary gets

too fresh when flow is > 2800 cfsAlso, pollution problems during high flowSlide12

Location in Estuary

RANGE

of Salinity

River

Ocean

Mid Estuary

0

Damming

and

Dumping

fresh water

increase variability

in estuary

35

Increased variability due to human interference

Increased stress for SAVSlide13

South FL Water Management District and the

Comprehensive Everglades Restoration Plan

CERP

Projects should decrease the temporal variability of salinity in the Caloosahatchee Estuary by allowing a more steady amount of freshwater to be released through the S-79 lock and damSlide14

SAV Monitoring Objectives for the Caloosahatchee River Estuary

Determine SAV trends and variability from 1998 to the present

Relate SAV status and trends to environmental conditionsTrack

SAV recovery as CERP is implementedSlide15

Methods

7 sites along estuary

Bimonthly monitoring1m2 quadrats

(30)SAV coverage, canopy height, etc.Historical data from SFWMD, back to 1998

Including salinity data

1 m

2Slide16

Results: 1998 – 2013 Freshwater Flow

Often, too much or too little water was releasedSlide17

Results: 1999 – 2013 Salinity

Temporal variability of salinity was extremeSlide18

Analysis: Linking Salinity to S-79 Flow

Strong Links: Less Flow = More SalinityMore Flow = Less SalinitySlide19

Linking SAV

to Salinity; Upper EstuaryVallisneria

died off whenever salinity got > 10 psuRecovery takes years

Down for the count?Slide20

Linking SAV

to Salinity; Middle EstuaryHalodule wrightii very scarce during low salinity

Recovery during higher salinity, but still strugglingSlide21

Conclusions

Diversity of SAV species with different salinity tolerances should allow

SAV along entire Estuary

But temporal variability of salinity is too highAdhering to flow envelope (450-2800 cfs) would helpSlide22

Issues for Future Research

Interactive effects of freshwater releases, nutrients, and grazing organisms could exacerbate salinity stresses

Invasive freshwater snail eats SAV, but hates salinity

Native grazers

clean

SAV and love salinity

Water releases contain nutrients that stimulate phytoplankton in water and epiphytes on SAVSlide23

Acknowledgements

Elizabeth Orlando, Peter Doering and other SFWMD StaffDr. Aswani Volety, FGCULesli

Haynes, Christal Niemeyer, Tim BryantSylvie Mariolan, Heather Butler, Whitney McDowell, Spencer

Talmage, Romina Robles, Amber Chaboudy, and many other FGCU undergraduate students