/
Agroclimatología  y el Riego sustentable Agroclimatología  y el Riego sustentable

Agroclimatología y el Riego sustentable - PowerPoint Presentation

priscilla
priscilla . @priscilla
Follow
65 views
Uploaded On 2023-10-27

Agroclimatología y el Riego sustentable - PPT Presentation

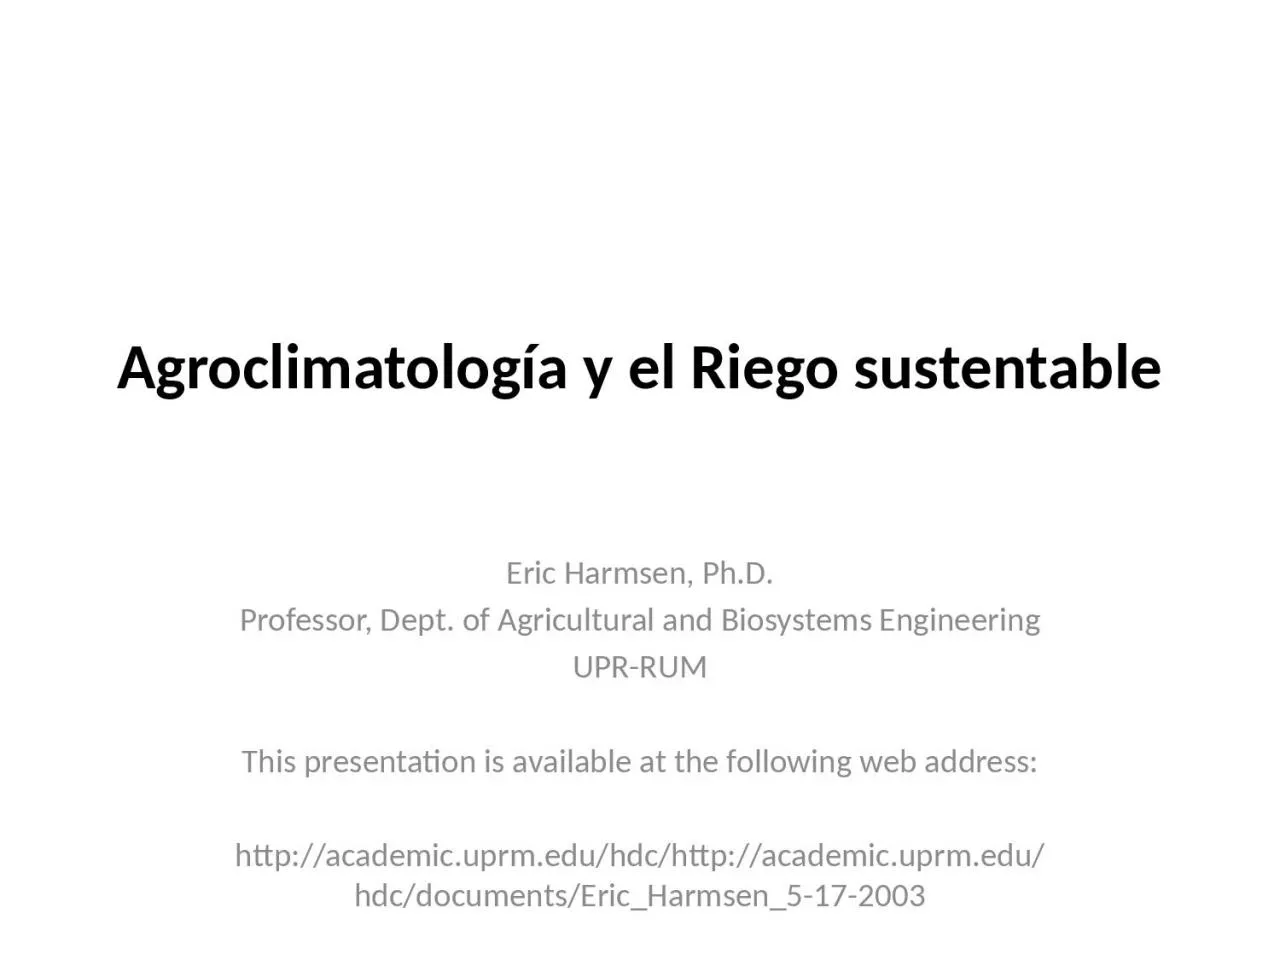
Eric Harmsen PhD Professor Dept of Agricultural and Biosystems Engineering UPRRUM This presentation is available at the following web address httpacademicuprmeduhdchttp academicuprmeduhdcdocuments ID: 1025757

crop water problem irrigation water crop irrigation problem evapotranspiration table coefficient eto day requirement cost puerto season normalized yield

Share:

Link:

Embed:

Download Presentation from below link

Download Presentation The PPT/PDF document "Agroclimatología y el Riego sustentabl..." is the property of its rightful owner. Permission is granted to download and print the materials on this web site for personal, non-commercial use only, and to display it on your personal computer provided you do not modify the materials and that you retain all copyright notices contained in the materials. By downloading content from our website, you accept the terms of this agreement.


Presentation Transcript

1. Agroclimatología y el Riego sustentableEric Harmsen, Ph.D.Professor, Dept. of Agricultural and Biosystems EngineeringUPR-RUMThis presentation is available at the following web address:http://academic.uprm.edu/hdc/http://academic.uprm.edu/hdc/documents/Eric_Harmsen_5-17-2003

2. What is the problem and why do I care?There is antidotal evidence that many farmers throughout the world do not employ scientific methods for scheduling irrigation for their crops. Instead, the water supply is turned on for an arbitrary amount of time without knowing whether the amount of water applied is too much or too little. Over application of water can lead to the waste of water, energy, chemicals and money, and also may lead to the contamination of ground and surface waters. Over application of water can further lead to leaching of fertilizers past the root zone and water logging, which will result in lower crop yields. Under-application of irrigation water can lead to water stress with reduced crop yields and a loss of revenue to the grower.

3. How much water and money are we talking about?

4. The Cost of Over-Applying Irrigation WaterAssume the following: Small 10-acre farm grows pumpkin Estimated consumptive use (CU) for season = 500 mm Actual potential CU for season = 400 mm Overall cost of water = $30/acre-ft (considering only: cost of water and electricity) Assume the normalized yield vs. CU curve in the next slide is applicable. Value of a typical Calibaza crop (net income)* = $1,243/acre.*Conjunto Tecnológico para la producción de Calabaza, UPR Experment Station, Publication 155, revised 2012

5.

6. Example continuedResults: Excess water applied = 100 mm = 1.07million gallons = 3 acre-ft (lost to groundwater) Normalized CU = 1.25, therefore normalized yield = 0.9 (or 0.1 loss) Potential $ LOST = cost of water + lost yield = 3 ac-ft x $30/ac-ft + [0.1*$1,243/ac] x 10 ac = $1,333 Agr. Chemicals are leached to groundwater (cost was not included in calcluation). Groundwater was potentially contaminated

7. Cost of Under-Applying Irrigation WaterAssume the following: Same pumpkin farm (10-acres) Estimated CU for season = 300 mm Actual potential CU for season = 400 mm Assume the normalized yield vs. CU curve is applicable. Value of a typical Calibaza crop* = $1,243/acre.*Conjunto Tecnológico para la producción de Calabaza, UPR Experment Station, Publication 155, revised 2012

8. Example continuedResultsWater deficit = 100 mm With a normalized CU of 0.75, the normalized yield = 0.85 (or 0.15 loss) Potential $ LOST = lost yield = [0.15*$1,243/ac] x 10 ac = $1,864$1,864 could pay your daughter’s university tuition or pay her rent for 6 months

9. How can I apply water to my plants?Different types of irrigation systemsSurface IrrigationSprinkler IrrigationDrip IrrigationSubsurface IrrigationCondensation Method

10. Surface

11. Sprinkler

12.

13.

14. Drip

15.

16. Irrigation system accessories

17. Fertigation

18. Drip Irrigation Laboratory at UPRM

19. Drip Distribution UniformityDistribution Uniformity is critically important in Drip IrrigationWhy?Sometimes a plant only has one emitter. If the emitter is plugged, then the plant may die.If water is applied non-uniformly, then fertilizer will also be applied non-uniformly.

20.

21. Subsurface

22. Condensation

23. Commercial dew condensation in (Israel)To reduce the amount of irrigation water by as much as 50 to 90%Tal-Ya Water Technologies, Inc. info@tal-ya.com

24. Commercially available dew condenser (Holland)Broasis waterboxx www.aquaproholland.com

25. Fog collection projectswww.foguest.org Chile ( fanel 150 to 750 liters of water a day) with 100 fog collectors = 15, 000 L/ year Peru ( 2271 liters of water a day )with 7 fog collectors.

26. Appropriate Technology

27.

28.

29. Water Supply

30. GroundwaterPumps

31. Irrigation Ponds

32. Other Technologies

33. How much water should I apply?Evapotranspiration = evaporation from soil and wet surfaces + transpiration from leavesEvapotranspiration = plant water requirement

34. Why Do I Care? (reminder)Over application of water Waste of Waterenergychemicals money, may lead to the contamination of ground and surface waters. leaching of fertilizers past the root zonewater logginglower crop yields. Under-application of waterLead to Crop water stress reduced crop yields loss of revenue to the grower“I wish I would have applied more irrigation.”

35. Intro to AgroclimatologyDefinition of climate, weather meteorologyWeather parametersTemperatureHumidityWind speed and directionSolar radiationOptional parameters that can be measured by weather stationsSoil moisture, leaf wetness, net radiation, soil heat flux

36. Weather Station Sensors

37.

38. Many weather stations will calcuate the daily Evapotranspiration

39. Natural Resource Conservation ServiceSCAN Stationshttp://www.wcc.nrcs.usda.gov/scan/Puerto_Rico/puerto_rico.html

40. National Weather Service – San Juanhttp://www.srh.noaa.gov/sju/

41. SoilsClay SandHigh Water Holding CapacityLow Water Holding Capacity

42. So how can I determine the crop water requirement and then apply the correct amount of irrigation? Here is a web-based method that can be used anywhere within Puerto RicoThe method will be introduced by way of an exampleDetailed Example : Determine the irrigation requirement for the 5 day period, February 15-19, 2012, for a tomato crop in Juana Diaz, Puerto Rico. Table 1 summarizes the information used in the example problem. Table 2 provides the important web addresses necessary for obtaining data for use in the example problem. Table 3 shows the crop growth stage and crop coefficient (Kc) data for the example problem.

43. Table 1. Information used in example problem. Table 2. Internet URLs for example problem.Table 3. Crop growth stage and crop coefficient data for example problem.

44. Determine Crop Water RequirementET = Kc ETowhere ET = evapotranspiration = crop water requirementKc = Crop Coefficient (unique for every crop)ETo = Reference Evapotranspiration

45. RainfallA rain gauge is not available on or near the farm; therefore, it is necessary to obtain rainfall information from the NEXRAD radar. Inspection of the rainfall maps at the URL provided in Table 2 indicates that there was no rainfall during the five day period. Therefore, all of the crop water requirement will have to be satisfied with irrigation.

46. Reference Evapotranspiration (ETo)The next step is to determine the reference evapotranspiration (ETo) for the five day period. The next slide shows the estimated reference evapotranspiration for Puerto Rico on February 15, 2012 obtained from the web address provided in Table 2. The estimated ETo for the site location on 15 Feb., 2012 is 2.95 mm. Using a similar procedure, the ETo values for Feb. 16, 17, 18 and 19 are 2.8 mm, 3.1 mm, 3.5 mm and 3.7 mm, respectively. Summing up the ETo values comes to a total reference evapotranspiration (for the five days) of 16.1 mm.

47. Reference Evapotranspiration

48. Crop CoefficientThe Kc value of 0.85 was obtained from the figure in the next slide. Crop coefficient curve for the example problem. The heavy dashed line applies to the example problem with day of season 46-50 (i.e., Feb 15-19) corresponding to an approximate crop coefficient of 0.85 (vertical axis).

49. Crop Water RequirementET = Kc EToThe crop water requirement (ET) for the time period can now be estimated as follows: ETc = Kc ETo = (0.85)(16.1 mm) = 13. 7 mm.

50. Crop Coefficient Curve for TomatoCrop coefficient curve for the example problem. The heavy dashed line applies to the example problem with day of season 46-50 (i.e., Feb 15-19) corresponding to an approximate crop coefficient of 0.85 (vertical axis).

51. Number of hours to run the pump to satisfy the crop water requirementThe final step is to determine the number of hours that the pump should be run to apply the 13.7 mm of water. A form of the well-known irrigation equation (Fangmeier et al., 2005) can be used: T = 17.817 x [D x A]/[Q x eff]where T is time in hours, D is depth of irrigation water in mm, A is effective field area in acres, Q is flow rate in gallons per minute and eff is irrigation system efficiency. Using D = 16.1 mm, A = 10 acres, Q = 300 gallons per minute and eff = 0.85, yields: T = 17.817 x [16.1 x 10] / [300 x 0.85] = 11.25 hours.

52. In ConclusionOperating the pump for 11.25 hours will satisfy the crop water requirement. The approach presented here is relatively simple and the near-real time data is available to any farmer in Puerto Rico with internet access.