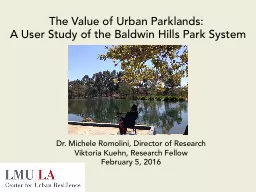
Viktoria Kuehn Research Fellow February 5 2016 The Value of Urban Parklands A User Study of the Baldwin Hills Park System Semiannual Report Season 1 Overview of Presentation Background ID: 784330
Download The PPT/PDF document "Dr. Michele Romolini, Director of Resear..." is the property of its rightful owner. Permission is granted to download and print the materials on this web site for personal, non-commercial use only, and to display it on your personal computer provided you do not modify the materials and that you retain all copyright notices contained in the materials. By downloading content from our website, you accept the terms of this agreement.
Slide1
Dr. Michele Romolini, Director of ResearchViktoria Kuehn, Research FellowFebruary 5, 2016
The Value of Urban Parklands: A User Study of the Baldwin Hills Park System
Slide2Semiannual Report – Season 1Overview of Presentation
BackgroundPark User SurveyGame Camera Visitation StudyStudent Involvement
Current Status
Slide3BACKGROUNDIntroduction to Project
Slide4Purpose of StudyResearch shows that urban parks are critical resources providing users with extensive mental and physical health benefits,
and protecting open spaces and natural habitatUrban parks often are not given as much appreciation or funding at the state and federal levelsThe Baldwin Hills urban park system serves diverse residents of Culver City, Los Angeles, Inglewood, local unincorporated counties, and the Larger Los Angeles County, as well as tourists and visitors from other parts of the
regionA large-scale
study of
park
users has
not been
done until now
Coincides with the implementation of
“Park to
Playa
This
study seeks to better understand BH park user behavior to inform stakeholders and future park planning efforts.
Slide5Research ApproachA 3-year study examining park user behavior using two different methods:
Park User Survey: delivered on-site to visitors in the Baldwin Hills park system during several field collection periods
Game Camera Visitation Study monitoring five locations in the park continuously
Slide6Research Timeline
Aug 2014:
Pilot survey began. Collected ~250 surveys in 7 locations over 2 months. Tested survey instruments & field methods.
Dec 2014:
Presented pilot results to BHC Board and solicited feedback.
July 2017:
Project ends. Final report and related presentations and products to be submitted to BHC.
Early 2015:
Modified methods and survey design to incorporate input from researchers, BHC staff & Board.
May 2015:
Identified locations for game camera visitation study, began study design.
Jun-Sept 2015:
Season 1
of full field collection. Collected 363 surveys in 14 locations, using updated methods.
Aug 2015:
Launched game camera visitation study. Field tested cameras and began data collection.
Jan-Apr 2016:
Season 2
of full field collection.
Currently in progress!
Jun-Sept
2016:
Season 3
of full field collection.
Jan-Apr 2017:
Season 4
of full field collection.
Slide7PARK USER SURVEYSeason 1 Progress
Slide8Slide9Park User Survey
Visitor survey questions
focused on the following:
1) Frequency of use,
2) Demographics,
3) Park activities,
4) Park accessibility, and
5) Environmental awareness
Slide10Survey Distribution
Slide11Select Findings – Visitation Rates
Slide12Select Findings – Demographics
54% Female,
44% Male
Age range from 18-64, with average of 32
23% Hispanic or Latino
Slide13Select Findings - Activities
When asked to indicate all of their activities in the park, users reported both active (walking and jogging) and passive (enjoying nature and social activities) in their top uses. This indicates
the need to be sensitive to multiple user communities when making improvements and changes to the park.
Slide14Select Findings - Accessibility
Mode of Transportation
How did you get to the park today?
If given the choice of transportation options, what would be your preferred way to get to the park?
Walk
12%
19%
Bike
10%
21%
Car/SUV/Truck
73%
54%
Bus
4%
2%
Train
0%
1%
Motorcycle/Scooter
1%
1%
Other
1%
1%
Related: Only
12% reported their awareness of the
County shuttle
, but 41% said they would
utilize this service.
This suggests there may need to be increased signage or other
outreach.
Slide15Select Findings - Environment
A large majority (73%) responded
“yes” when asked “would you like to better understand the region’s environment from the parks to the ocean?” Most are interested in learning more about human health and the
environment.
Slide16GAME CAMERA VISITATIONSeason 1 Progress
Slide17Game Camera StudySupplement to the user surveyGame cameras are good at capturing rare behaviors and ongoing activity
Monitor both official and “unofficial” entrancesBeginning in May 2015, research team went on a series of site visits in the Baldwin Hills parks to assess the scope of sites, determine
logistics of positioning and settings, and finalize location choicesDeveloped study design and purchased
five Browning “Dark Ops” High Definition Trail Cameras, SD cards and
batteries
Hired and trained an
undergraduate research technician to monitor the cameras and collect
data
Conducted field testing
Installed cameras
Began collecting data in October 2015
Collected 100s of hours of data from each site
Slide18Slide19Slide20STUDENT INVOLVEMENTTraining & Research Experiences
Slide21Students in the Field
Slide22Students in the FieldIn addition to producing research and reports, we believe an important part of this project is training the next generation of professionalsStudents are receiving extensive training in social science and environmental studies theories and methodologies, but they are also being exposed to a park system right next to campus that many of them have never been to before
Students provide qualitative observations that contribute to the research process, thus engaging them in the results and giving them a sense of personal responsibility for the project and how it informs park management and improvement
Slide23Examples of Student Observations
Slide24Student TrainingSince August 2014, we have involved a total of 33 LMU undergraduates in the Baldwin Hills Park User Study In Season 1, we had a team of 14 students
13 survey research assistants who spent 532 hours in the fieldOne game camera research technician who spent 34.5 hours on set-up and data collection
Slide25CURRENT STATUSSeason 2 Progress
Slide26Season 2 ProgressRecruited students and held an orientation during the second week of LMU’s spring semester, in mid-January Students completed online survey research training
Held a field training on January 30 and sent the first students into the field on January 31Students scheduled for 25 4-hour shifts in February, covering all weekends and every MWF during the week
Slide27Future PlansStudents will be scheduled throughout March and possibly April, depending on completion rateSurvey will be closed by the end of April, results analyzed and a report sent by June 1
Students will be recruited for Season 3 starting in March/April and trained in May
Slide28Questions?Michele Romolini, Ph.D. & Viktoria
KuehnLMU Center for Urban Resiliencemichele.romolini@lmu.edu(310) 338-7443