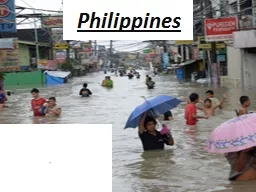
/
Food Security and Agriculture- Philippines Food Security and Agriculture- Philippines

Food Security and Agriculture- Philippines - PowerPoint Presentation

roy
roy . @roy
Follow
0 views
Uploaded On 2024-03-15

Food Security and Agriculture- Philippines - PPT Presentation

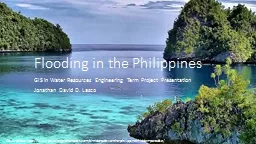
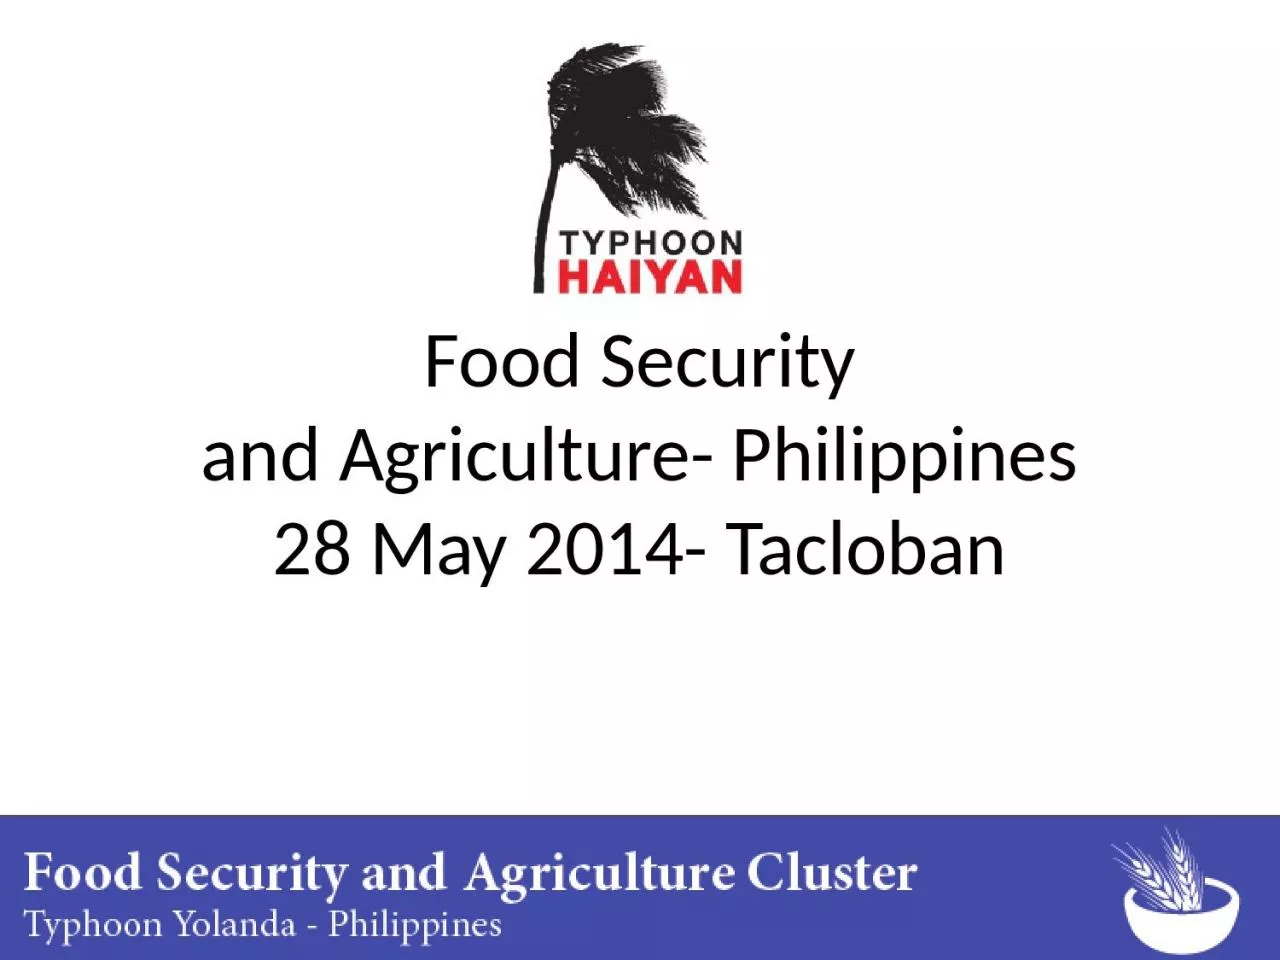
28 May 2014 Tacloban Agenda Introduction Presentation of WFP post distribution monitoring results SRP revision of projects Final FSAC inputs for SRP Risk factors key recovery priorities amp gaps during this ID: 1048342

srp region cash samar region srp samar cash key reached distribution fsac activities indicator food monitoring capiz iloilo 2014

Share:

Link:

Embed:

Download Presentation from below link

Download Presentation The PPT/PDF document "Food Security and Agriculture- Philippin..." is the property of its rightful owner. Permission is granted to download and print the materials on this web site for personal, non-commercial use only, and to display it on your personal computer provided you do not modify the materials and that you retain all copyright notices contained in the materials. By downloading content from our website, you accept the terms of this agreement.


Presentation Transcript

1. Food Securityand Agriculture- Philippines28 May 2014- Tacloban

2. AgendaIntroductionPresentation of WFP post distribution monitoring resultsSRP- revision of projectsFinal FSAC inputs for SRPRisk factors, key recovery priorities & gaps during this transition period (OCHA)AOB; FSAC structure; Schedule of meetings        

3. Monitoring results from EMOP 200631: Assistance to the people affected by Super Typhoon Haiyan

4. The report covers the period: December 2013 to February 2014.It contains the results to date from distribution and post-distribution monitoring of WFP activities: general food distribution, unconditional cash transfers and supplementary feeding programmes.WFP monitoring systems went to lengths to ensure that relief activities did not negatively impact market conditions.

5. Key findings5

6. Key findingsCash transfers:Gradual, limited injections of cash was appropriate starting west in Region VI and moving east towards the more severely affected Region VIII to enable a staggered approach facilitating market recovery.Limited cash injections showed potential to jump-start retail supply capacity and household-level effective demand.6

7. Key findings

8. Key findings93 percent of cash beneficiaries reported access to functioning markets. Over 96 percent of cash recipients indicated that therewas sufficient availability of their preferred foods in those markets.8

9. Key findings9

10. 10Thank you

11. SRP projectsFTS

12. FSAC funding status Original requirements USD ARevised requirements USDBFunding*USDDTotal resourcesavailable USDE=C+DUnmet requirementsB-E% CoveredE/BUncommittedpledgesF100,113,302184,967,524121,033,116121,033,11663,934,40865%1,628,500Are the Contributions reports accurate/updated?Are we still appealing for the unfunded activities?Do we need to de-earmark mark some activities?http://fts.unocha.org/reports/daily/ocha_R32_A1043___21_May_2014_(16_38).pdf

13. Data received so farSRP -Outputs

14. Output Indicator 1.1.1 - # of individuals receiving food assistance (through general food distribution) RegionProvinceReached (SRP)Reached (Non-SRP)TotalRegion IV-BPalawan  7,6707,670 Region VI Aklan 134,890 134,890 Antique90,107 90,107  Capiz 106,395 106,395  Iloilo 198,025 35,695233,720  Negros Occidentales   Region VIICebu 21,920  75,92097,840Region VIIIEastern Samar588,798 96,660685,458 Leyte1,905,354 213,8752,119,229 Biliran25,955  1,57527,530 Samar (Western Samar)139,853 41,735181,588 Southern Leyte  Region VMasbate  Region XDingat Islands    Total3,211,297 4731303,657,203

15.

16. Indicator 1.1.3 - # of persons reached with cash transfersRegionProvinceReached (SRP)Reached (Non-SRP)TotalRegion IV-BPalawan   Region VI Aklan 57,51357,513 Antique2,6352,635  Capiz 77,33377,333  Iloilo 60,64610,20070,846  Negros Occidentales Region VIICebu48,16019,80067.960Region VIIIEastern Samar132,3375055137,392 Leyte301,87124,705326,576 Biliran Samar (Western Samar)12,8055,63018,435 Southern LeyteRegion VMasbateRegion XDingat Islands  Total693,29965,390758,689

17.

18. Output Indicator 3.2.1 - # of affected farmers receiving agricultural inputs RegionProvinceReached (SRP)Reached (Non-SRP)TotalRegion IV-BORIENTAL MINDORO 1,133  1,133 Palawan1,178   1,178 Region VI Aklan 1,005   1,005  Antique 480   480   Capiz 3,444   3,444   Iloilo 2,699   2,699   Negros Occidentales  Region VIICebu   Region VIIIEastern Samar 183  183 Leyte24,999  845 25,844 Biliran1,864   1,864  Samar (Western Samar)3,759 774 4,533  Southern Leyte  Region VMasbate  Region XDingat Islands    Total 41,043 740 41,230

19.

20. Output Indicator 3.2.4 - # of fisherfolk with boats repaired and built RegionReached (SRP)Reached (Non-SRP)Region IV-B 272 Region VI 462 2,049Region VII 1,964Region VIII 10,484Region V Region X Total462 14,769

21.

22. FSAC structureSchedule of meetingsAOB

23. Updates New coordinator to RoxasTacloban and Roxas- 3 meetings per monthCTWG x1FTWG x1FSAC general meeting x1Manila- one meeting per month

24. Thank YOU