/
Vaccine-preventable diseases cause tens of thousands of potentially-preventable Vaccine-preventable diseases cause tens of thousands of potentially-preventable

Vaccine-preventable diseases cause tens of thousands of potentially-preventable - PowerPoint Presentation

roy
roy . @roy
Follow
0 views
Uploaded On 2024-03-13

Vaccine-preventable diseases cause tens of thousands of potentially-preventable - PPT Presentation

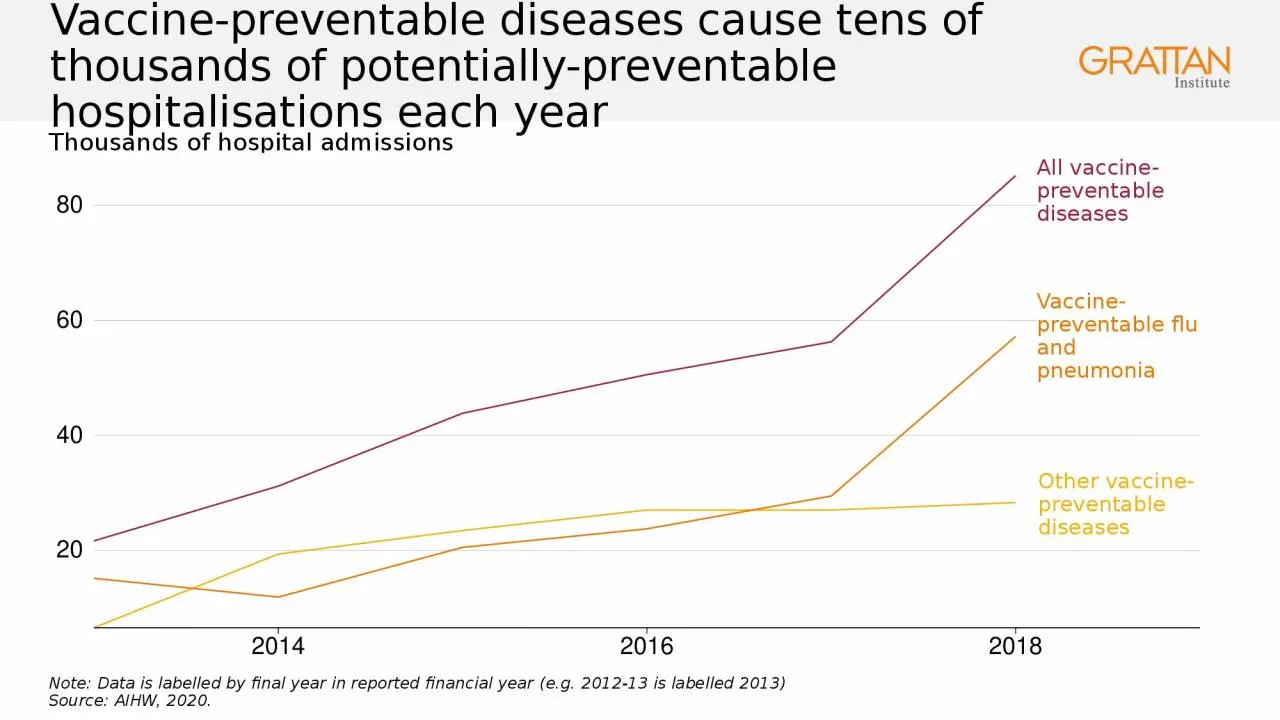
hospitalisations each year Thousands of hospital admissions 20 40 60 80 2014 2016 2018 Note Data is labelled by final year in reported financial year eg 201213 is labelled 2013 ID: 1048077

risk 2023 high vaccine 2023 risk vaccine high people covid june months abs vaccination aged source analysis grattan older

Share:

Link:

Embed:

Download Presentation from below link

Download Presentation The PPT/PDF document "Vaccine-preventable diseases cause tens ..." is the property of its rightful owner. Permission is granted to download and print the materials on this web site for personal, non-commercial use only, and to display it on your personal computer provided you do not modify the materials and that you retain all copyright notices contained in the materials. By downloading content from our website, you accept the terms of this agreement.


Presentation Transcript

1. Vaccine-preventable diseases cause tens of thousands of potentially-preventable hospitalisations each yearThousands of hospital admissions20406080201420162018Note: Data is labelled by final year in reported financial year (e.g. 2012-13 is labelled 2013)Source: AIHW, 2020.All vaccine-preventable diseasesVaccine-preventable flu and pneumoniaOther vaccine-preventable diseases

2. Regular vaccinations reduce the risk of hospitalisationCOVID vaccine effectiveness in people aged 65 and olderVaccine effectiveness from addition dose of COVID vaccine. Effectiveness estimated for two time periods: Jan-31 May, 2022, and 1 June-30 November, 2022. Data from Australia. See Liu et al (2023) for confidence intervals. Source: Liu et al (2023).Dose 3Dose 4024602460%50%100%Months since vaccinationJanuary-May 2022June-November 2022

3. High-risk adults are missing out on recommended vaccinesVaccination rates 0%20%40%60%FluShinglesCOVIDPneumoccocalNotes: COVID vaccine in six months before June 2023; flu vaccine in three months before June 2023: people aged 65 and older or two or more high-risk conditions. Shingles and pneumococcal vaccination rates for people aged 70-79.Source: Grattan analysis of ABS MADIP (2023) and NCIRS (2021).

4. Pre-winter coverage was much lower in 2023 than 2022Per cent vaccinated against COVID0%25%50%75%100%January 2022January 2023High-risk adultsLower-risk adultsThird COVID vaccine availableNotes: COVID vaccine in six months before June 2023. People aged 65 and older or two or more high-risk conditions. Source: Grattan analysis of ABS MADIP (2023).

5. Disadvantaged high-risk adults miss out on vaccinesVaccination rate compared to average personCOVIDFlu-60%-40%-20%0%-60%-40%-20%0%Not proficient in EnglishDoes not speakEnglish at homeIndigenous peopleRemote/very remoteLow incomeNo bachelor’s degreeNotes: COVID vaccine in six months before June 2023; flu vaccine in three months before June 2023. People aged 65 and older or two or more high-risk conditions. Source: Grattan analysis of ABS MADIP (2023).

6. Vaccination rates for high-risk adults in disadvantaged groups are getting worseCOVID vaccination rate compared to average high-risk person-60%-40%-20%0%June 2022June 2023Not proficient in EnglishDoes not speak English at homeIndigenous personRemote/very remoteLow incomeNo bachelor’s degreeNotes: COVID vaccine in six months before June 2023. People aged 65 and older or two or more high-risk conditions. Source: Grattan analysis of ABS MADIP (2023).

7. High-risk adults living in remote and very remote areas are less likely to be vaccinatedPer cent of people vaccinatedCOVIDflu0%20%40%60%0%20%40%60%Very remoteRemoteOuter regionalInner regionalMajor cityNotes: COVID vaccine in six months before June 2023; flu vaccine in three months before June 2023. People aged 65 and older or two or more high-risk conditions. Source: Grattan analysis of ABS MADIP (2023).

8. Vaccination rates vary dramatically within citiesVaccination rates against COVID and flu, high-risk adultsHobartAdelaidePerthBrisbaneMelbourneSydney20%40%60%80%MosmanBoroondaraInner-west BrisbaneHoldfast BayCottesloe / ClaremontFairfieldTullamarine / BroadmeadowsSouthportPlayfordKwinanaNorth-west HobartNorth-east HobartCanterburyTullamarine / BroadmeadowsMudgeeraba / TallebudgeraInner-west BrisbanePlayfordKwinanaPennant Hills / EppingEastern StonningtonCottesloe / ClaremontBurnsideNorth-west HobartNorth-east HobartAverage for COVIDAverage for fluNotes: COVID vaccine in six months before June 2023; flu vaccine in three months before June 2023. People aged 65 and older or two or more high-risk conditions. SA3 areas are based on ABS Major Cities of Australia classification for all capitals except Hobart; SA3 from Hobart are classified as Inner RegionalSource: Grattan analysis of ABS MADIP (2023).

9. Not speaking English at home, and not speaking it proficiently, increases the risk of missing outVaccination rate for COVID and fluCOVIDFluProficientNot proficientProficientNot proficient0%20%40%60%Average for people who speak English at homeNotes: Circles represent language groups; circle size represents number of speakers. COVID vaccine in six months before June 2023; flu vaccine in three months before June 2023. People aged 65 and older or two or more high-risk conditions. Source: Grattan analysis of ABS MADIP (2023).

10. People born overseas usually have lower COVID vaccination rates and higher COVID death ratesAge-standardised death rates per 100,000 peopleNotes: Includes all certified COVID-19 deaths registered by 31 July 2023. COVID vaccine in six months before June 2023; flu vaccine in three months before June 2023. People aged 65 and older or two or more high-risk conditions. Source: Grattan analysis of ABS MADIP (2023) and ABS (2023).01020304010%20%30%40%COVID vaccination rate, high-risk peopleSouth-eastern EuropeAustraliaMiddle EastNortheast AsiaNorth AfricaEastern EuropeSouthern EuropeSouthern and Central AsiaSoutheast AsiaOceania and AntarcticaSub-Saharan AfricaAmericasNorth-western EuropeUK and Ireland

11. Disadvantaged people are less likely to be vaccinatedPer cent vaccinated against COVID or fluCOVIDFlu0%20%40%60%Level of disadvantageMost disadvantagedLeast disadvantagedNotes: COVID vaccine in six months before June 2023; flu vaccine in three months before June 2023. People aged 65 and older or two or more high-risk conditions. Based on IRSD deciles.Source: Grattan analysis of ABS MADIP (2023).Most disadvantagedLeast disadvantaged

12. Each additional risk to vaccine access pushes vaccination rates downPer cent vaccinated against COVID0%20%40%01234Average vaccination rate, one disadvantageVaccination rate, people who don’t speak English at homeNotes: COVID vaccine in six months before June 2023. People aged 65 and older or two or more high-risk medical conditions. Vaccine acces risks include speaking a language other than English at home, not being proficient in English, being an Aboriginal or Torres Strait Islander, having a low income, and not having a bachelor's degree. 4,041,980 high-risk adults in this sample: 524,960 with no disadvantages; 1,925,100 with one; 1,193,940 with two; 297,510 with three; and 100,470 with four or more. Source: Grattan analysis of ABS MADIP (2023).Number of risks to vaccine access

13. Low-vaccination groups often face other health challengesRate of relative riskIndigenous peopleRegionaland remoteMostdisadvantaged1x2x3x1x2x3x1x2x3xLiving with obesityHave 2 or morechronic conditionsSkip or delay dentalcare due to costYears lived with disease or disabilityYears of life lostto premature deathA daily smokerNotes: ‘Years of life lost due to premature death’ and ‘years lived with disease or disability’ rates are derived by comparing years. All other rates are derived by comparing proportion of people.Source: Grattan analysis of ABS (2022a), AIHW (2020b), AIHW (2023a), AIHW (2023b), AIHW (2023c), ABS (2022b), AIHW (2023d), ABS (2022c), ABS (2020), AIHW (2021a), AIHW (2021b) and AIHW (2022b).

14. Some people have higher barriers to vaccinationUniversal actionsActions to remove common, minimal barriers, such as low awareness or inconvenience, including vaccination surges supported with reminders. Targeted actionsMore focussed measures to reduce moderate barriers such as cultural barriers or living in aged care.Tailored actionsIntensive programs to address complex barriers such as distrust of the health system and poverty.Greater population Bigger barriers to vaccination Source: Grattan analysis

15. Key reforms should be part of a new National Vaccination AgreementFederal & PHNStatesTargetsTargets for population vaccination coverageTargets for low-vaccination communitiesActionsCan be shared or shifted by agreementUniversal measures for people with low barriers (surges, advertising, reminders)Targeted measures to increase vaccination in primary care (PHN funding and accountability)Tailored programs for groups with the lowest vaccinationEnablersNational Vaccination Strategy outlining risks, priorities, and actionsJoint funding for tailored programsData sharing with PHNs, states, GP clinics and pharmaciesPublic reporting on progress towards targets and vaccination rates in aged care facilitiesImplementation group to share information and coordinate actionNotes: PHN = Primary Health NetworksSource: Grattan analysis

16. Nearly all high-risk people see a GPPer cent0%25%50%75%100%15-2425-3435-4445-5455-6465-7475-8485+Note: At least one visit in the 2021-22 financial year. Source: ABS (2022d).

17. Robustness checks: COVID vaccinationsAverage vaccination rate 0%25%50%High risk6 monthsHigh risk9 months75 and older6 monthsNotes: COVID vaccine in six months before June 2023. High-risk = people aged 65 and older or two or more high-risk conditions. Source: Grattan analysis of ABS MADIP (2023).

18. Robustness checks: COVID differences between groupsCOVID vaccination rates compared to the averageNot proficientSpeaks LOTEIndigenousRemote/very remoteLow incomeNo Bachelor's-70%-60%-50%-40%-30%-20%-10%0%High-risk, 6 monthsHigh-risk, 9 months75 and older, 6 monthsNotes: COVID vaccine in six months before June 2023. High-risk = people aged 65 and older or two or more high-risk conditions. Source: Grattan analysis of ABS MADIP (2023).

19. Robustness check: Flu average vaccination ratesPer cent vaccinated against flu0%25%50%75%PopulationHigh riskNotes: Flu vaccine in three months before June 2023. High-risk = people aged 65 and older or two or more high-risk conditions. Source: Grattan analysis of ABS MADIP (2023).

20. Robustness check: Flu differences between groupsFlu vaccination rate compared to average personPopulationHigh risk-40%-20%0%20%-40%-20%0%20%IndigenouspeopleNot proficientin EnglishDoes not speakEnglish at homeRemote/very remoteLow incomeNo bachelor’s degree12 months3 monthsNotes: Flu vaccine in three months before June 2023. High-risk = people aged 65 and older or two or more high-risk conditions. Source: Grattan analysis of ABS MADIP (2023).