Explore
Featured
Recent
Articles
Topics
Login
Upload
Featured
Recent
Articles
Topics
Login
Upload
Search Results for 'median box'
median box published presentations and documents on DocSlides.
Box and Whisker Plots and the 5 number summary
by natalia-silvester
Mr. J.D. Miles. Turner Middle School. Atlanta Geo...
Box and Whisker Plots Order numbers
by lindy-dunigan
3, 5, 4, 2, 1, 6, 8, 11, 14, 13, 6, 9, 10, 7. Fi...
Chapter 12, Part 1
by tawny-fly
STA 200 . Summer I . 2011. Measures of Center an...
Box and Whisker Plots
by faustina-dinatale
and Quartiles. Sixth Grade. Five Statistical Summ...
Box and Whisker Plots
by lindy-dunigan
. Order numbers. 3, 5, 4, 2, 1, 6, 8, 11, 14, 1...
Click when ready
by pasty-toler
. Whiteboardmaths.com. © 2004 - 2008 All righ...
YEAR 11 MATHS REVISION
by phoebe-click
Box Plots. Cumulative Frequency with Box Plots. D...
Box and Whisker Plots
by briana-ranney
A diagram that summarizes data by dividing it int...
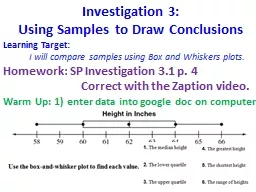
Investigation 3:
by alexa-scheidler
Using Samples to Draw Conclusions. Learning Targe...
Box and Whisker Plots A diagram that summarizes data by dividing it into four parts.
by natalia-silvester
It compares two sets of data.. Box and Whisker Pl...
Warm Up! Write down objective and homework in agenda
by ellena-manuel
Lay out homework (none!!). Homework (Box Plot . w...
7-5 Box-and-Whisker Plots
by lindy-dunigan
Course 2. Warm Up. Problem of the Day. Lesson Pre...
Box Plots
by test
Lesson . 8.04. After completing this lesson, you ...
measures of centrality
by olivia-moreira
Last lecture summary. Mode. Distribution. Life ex...
JV Stats HW & Test # 2
by briana-ranney
OUTLIER FORMULAS. BOX PLOTS. HISTOGRAMS. DESCRIBI...
ζ Cumulative Frequency Graphs
by trish-goza
Dr Frost. Starter: Problems involving mean. T...
MAT 1000
by yoshiko-marsland
Math. ematics. in . Today's . World. Last Time. ...
Chapter 6.4
by mitsue-stanley
Box and Whisker Plots. Quartile: include . Inter-...
Essential Questions • Why is it important to include all data even when the data set has repeatin
by tawny-fly
• What does the median of a box plot tell us ab...
Bell Ringer
by jubilantbikers
What is a median?. What is a mode?. Mean, Median, ...
You are what you eat? Mafs.912.S-ID.1.1
by mitsue-stanley
What’s for lunch?. Smoothie . Big Bang- Protein...
Modeling and Data Analysis
by luanne-stotts
High . School . Claim 4. Smarter Balanced Sample ...
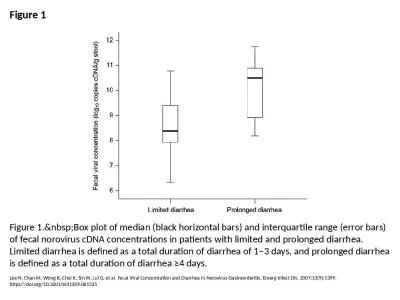
Figure 1 Figure 1. Box plot of median (black horizontal bars) and interquartile range (err
by arturo
Lee N, Chan M, Wong B, Choi K, Sin W, Lui G, et al...
Evaluation of Laboratory Methods to Quantify Chlorophyll-a
by norah
Phase I Results and Phase II Plans. 8/5/2020. Back...
4.2 Displays of Quantitative Data
by laobeast
Stem and Leaf Plot. A . stem-and-leaf plot. . sho...
Graphics Math, Social Studies, & Science
by liane-varnes
Georgia’s 2016 Adult Education Fall Conference....
Unit 6 Review Measures of Central Tendency, Measures of Variation
by myesha-ticknor
Displaying Data. Question 1a. What does 30 repres...
Linear filtering
by marina-yarberry
Motivation: Image . denoising. How can we reduce ...
Exploratory Data Analysis
by liane-varnes
John . Tukey. Developed these procedures to help ...
Stine & Foster 4 - 53
by briana-ranney
Car Models. Sold in US 2003-2004. Cars Problem. A...
Statistics and Data Analysis
by jane-oiler
Professor William Greene. Stern School of Busines...
Load More...