Explore
Featured
Recent
Articles
Topics
Login
Upload
Featured
Recent
Articles
Topics
Login
Upload
Search Results for ''
published presentations and documents on DocSlides.
Attribute Control Chart
by isabella2
Dr.. Raghu . Nandan. . Sengupta. Professor. Depa...
Chart 5.1: Total Number of Active Physicians per 1,000 Pers
by giovanna-bartolotta
1980 – 2011. Source: National Center for Health...
Putting it all together Housing Inventory Chart (HIC)
by tatyana-admore
Point-In-Time (PIT). Service Point (WISP). Carrie...
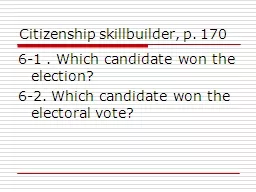
Citizenship skillbuilder, p. 170
by celsa-spraggs
6-1 . Which candidate won the election?. 6-2. Whi...
Control Charting:
by pamella-moone
Lessons Learned Along the Way. Why, What, and How...
Statistics and Data Analysis
by jane-oiler
Professor William Greene. Stern School of Busines...
Pie Charts
by calandra-battersby
Hmmmmm. ..Pie!. Pie Charts. WALT. Can you read a ...
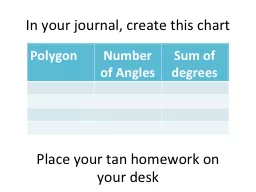
In your journal, create this chart
by marina-yarberry
Polygon. Number. of Angles. Sum of degrees. Plac...
6 Managing Quality
by phoebe-click
PowerPoint presentation to accompany . Heizer and...
Finding Clusters of Environmental
by stefany-barnette
Disease. Under S. 76. Testimony of Richard B Belz...
Statistical Process Control
by trish-goza
PowerPoint presentation to accompany . Heizer and...
The 7 Basic Tools of Quality
by test
(Ishikawa Tools of Quality). FREE Professional De...
Read Section 3.8 before viewing the slide show.
by mitsue-stanley
Unit 13. Electrons and their Relationship to the ...
x y Exploratory data analysis
by yoshiko-marsland
Cross tabulations and scatter diagrams. . Explor...
Managing Quality Chapter 3
by ani
Quality and Performance. Quality. A . term used by...
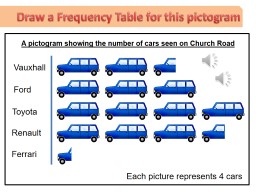
Draw a Frequency Table for this pictogram
by kimberly
Ferrari. Renault. Toyota. Ford. Vauxhall. A pictog...
Descriptive statistics (2)
by pagi
Qualitative data. 1. 2. Another Classification. ...
Bar Charts Objectives By the end of this section, students should be able to:
by julia
represent data in a bar chart. .. Use a chart.. Ba...
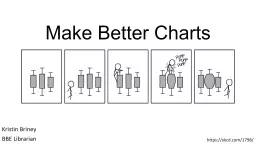
Make Better Charts Kristin Briney
by cadie
BBE Librarian. https://xkcd.com/1798/. It’s not ...
Data that is counted and has no in-between value is called
by lydia
discrete data. . Discrete data is usually collecte...
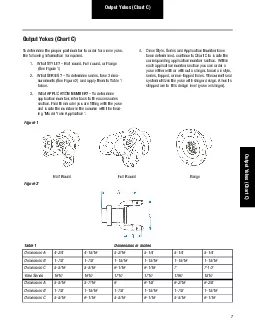
Output Yokes Chart C
by jainy
7Output Yokes Chart COutput Yokes Chart CTo determ...
Seating Chart Seating Chart
by danika-pritchard
Seating Chart. Warm Up 1/5-6. Imagine your boss w...
Continuous Improvement of School Climate Through a Data-Dri
by alexa-scheidler
Session S12. Will Black, Principal. Laura Walker,...
LESSON 4-1 Preparing a Chart of Accounts
by alexa-scheidler
Accounting in the real world & Internet Activ...
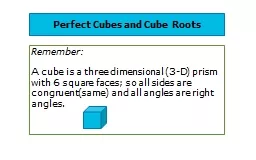
Remember:
by tatiana-dople
A cube is a three dimensional (3-D) prism with 6 ...
Patterns
by olivia-moreira
&. Functions. . Guided Practice. Teacher No...
Number Scrabble
by karlyn-bohler
Use the blank side of a hundred chart and number ...
3.7 Properties of Polygons
by marina-yarberry
I can identify different types of polygons.. I ca...
Multiplication and Division 9
by faustina-dinatale
Multiplication and Division 9. 5 x 10 = 50. Multi...
Permutation Investigations
by faustina-dinatale
Honors . Analysis. Ft. Thomas Exchange. Section 1...
STAT 101 Dr. Kari Lock Morgan
by kittie-lecroy
9/6/12. Describing Data: One Variable. SECTIONS 2...
STAT 101 Dr. Kari Lock Morgan
by stefany-barnette
Describing Data: One Variable. SECTIONS 2.1, 2.2,...
What makes a good mathematical game?
by natalia-silvester
What makes a good mathematical game? James Russo ...
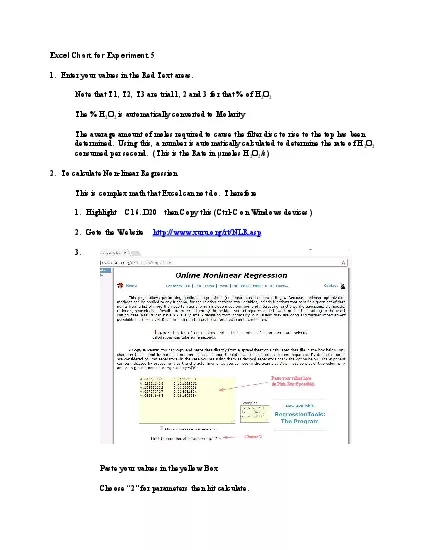
Excel Chart for Experiment 51 Enter your values in the Red Text areas
by fauna
3 Paste your values in the yellow BoxChoose 2 for...
International Place Value System
by kylie
Place Value Chart. In Mathematics, place value cha...
RSSDI ELECTION NOMINATION FLOW CHART
by carla
. Preparation for nomination form. . Before you ...
Brought to you by powerpointpros.com
by debby-jeon
ROMAN NUMERALS. What are Roman Numerals?. Basical...
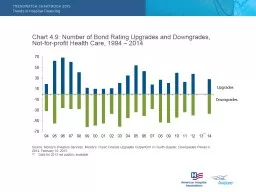
Chart 4.9: Number of Bond Rating Upgrades and Downgrades,
by lindy-dunigan
Not-for-profit Health Care, 1994 – 2014. Source...
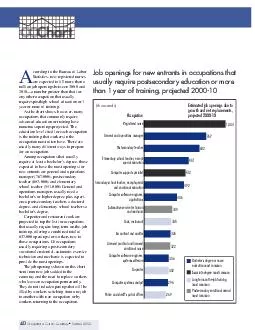
Occupational Outlook Quarterly Summer ccording to the Bureau of Labor Statistics new registered nurses are expected to fill more than a million job openings between and a number greater than that f
by pasty-toler
As the chart shows however many occupations that ...
feeding diapering chart Counting the number of diaper
by myesha-ticknor
And thanks to the builtin wetness indicator found...
Load More...