Explore
Featured
Recent
Articles
Topics
Login
Upload
Featured
Recent
Articles
Topics
Login
Upload
Search Results for 'Quality-Diagram'
Quality-Diagram published presentations and documents on DocSlides.
High-Quality Kitchen Trolleys in Pune |Adeetya's Kitchen & Furniture
by adeetyas
Adeetya's Kitchen & Furniture in Pune offers a sel...
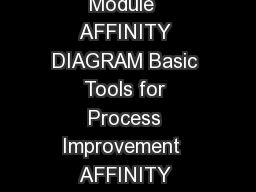
Basic Tools for Process Improvement AFFINITY DIAGRAM Module AFFINITY DIAGRAM Basic Tools for Process Improvement AFFINITY DIAGRAM What is an Affinity Diagram An Affinity Diagram is a tool that gath
by liane-varnes
The Affinity process is often used to group ideas...
Class diagram and State diagram for Banda
by pasty-toler
HyperMarket. Presented by Doha AL-. Mohsen. ID#20...
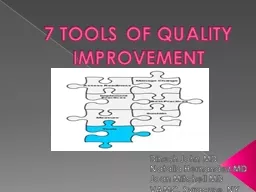
7 TOOLS OF QUALITY IMPROVEMENT
by alexa-scheidler
Dinesh John MD . Natalia Hernandez MD Joan Mitche...
WORKSHOP: Interactive Spaghetti Diagram:
by lois-ondreau
QI Starts with Awareness. Modinat Ogun, ASQ CSSBB...
Ishikawa Diagrams
by lois-ondreau
Thinking Creatively. Ishikawa Diagrams (or Herri...
Engaging a Medical Staff to Achieve Higher Value in Cancer Care
by cadie
J. Bingham and M. . Alma . Rodriguez. The . Univer...
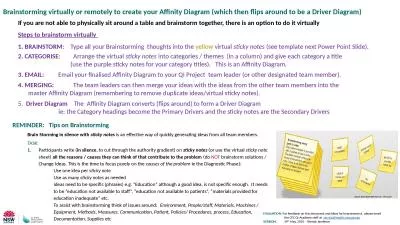
Brainstorming virtually or remotely to create your Affinity Diagram (which then flips around to be
by brown
If you are not able to physically sit around a tab...
Object & Class Diagram
by callie
Objects:. a . concept, abstraction, or thing with ...
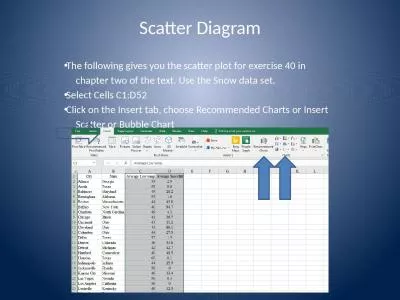
Scatter Diagram The following gives you the scatter plot for exercise 40 in
by davis
chapter two of the text. Use the Snow data set.. S...
Korjinski (activity/activity) Diagram
by bethany
construction for . the System . K. 2. O-Al. 2. O. ...
Epithelial Tissue Lab *Draw the diagram and answer the questions for each slide
by mia
1) Simple Columnar. . A. Diagram (cells are the ...
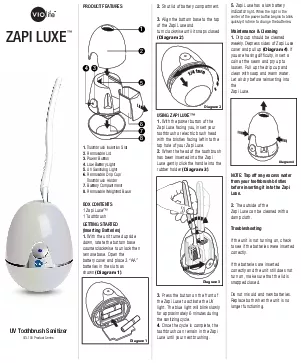
Diagram 4Diagram 2Diagram 3Diagram 4
by felicity
ZAPI LUXE153Diagram 151234678Diagram 1Diagram 3Dia...
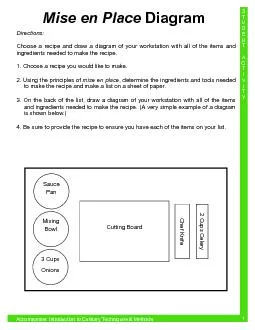
Choose a recipe and draw a diagram of your wingredients needed to make
by ethlyn
Bowl Cutting Board Chef Knife 2 Cups Celery ...
Beyond Feynman Diagrams Lecture 3
by jezebelfox
Lance Dixon . Academic Training Lectures. CERN. Ap...
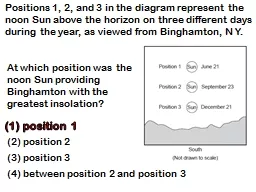
Positions 1, 2, and 3 in the diagram represent the noon Sun above the horizon on three different days during the year, as viewed from Binghamton, N Y.
by giovanna-bartolotta
Positions 1, 2, and 3 in the diagram represent th...
Introduction to IEC1131-3 Ladder Diagram CPU Origins of Ladder Diagram
by min-jolicoeur
Introduction to IEC1131-3 Ladder Diagram CPU Orig...
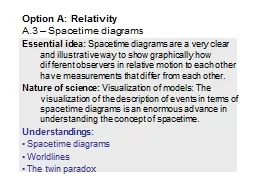
Essential idea: Spacetime diagrams are a very clear and illustrative way to show graphically how d
by tatiana-dople
Nature of science: . Visualization of models: The...
Block Diagram Reduction SUBMITTED BY:
by natalia-silvester
Mrs. . RAMANDEEP. KAUR. ASSOT. . PROFESSOR-EEE. ...
Plot Diagram Introduction to Plot Diagram Terminology
by natalia-silvester
Short stories . All short stories have a plot tha...
Use Case Diagram (UCD) Yong Choi
by karlyn-bohler
BPA. What is UCD?. A use case is a set of . scena...
ER Diagram Notation E-R Diagram:
by danika-pritchard
Chen Model. Entity. represented by a rectangle wi...
Beyond Feynman Diagrams
by myesha-ticknor
Lance Dixon . Academic Training Lectures. CERN. A...
UML : DIAGRAMME DE CAS d’UTILISATION
by pasty-toler
UML : DIAGRAMME DE CAS d’UTILISATION. GENERALIT...
Using Tape Diagrams and
by lois-ondreau
Variables to Develop . A. lgebra Skills. Core Mat...
1 Voronoi Diagrams
by tawny-fly
The Post Office Problem. POORiA Haddad. Haddad.po...
DEVELOPMENT OF INTERACTION DIAGRAMS
by trish-goza
1. DEVELOPMENT OF INTERACTION DIAGRAMS. Should an...
Venn and Tree Diagrams in Probability
by alida-meadow
B. y. Daniel Christie. Probability. In a class o...
The Hertzsprung-Russell Diagram
by calandra-battersby
. Our . Objectives. To . determine the . physica...
Beyond Feynman Diagrams
by lois-ondreau
Lecture 3 . Lance Dixon . Academic Training Lectu...
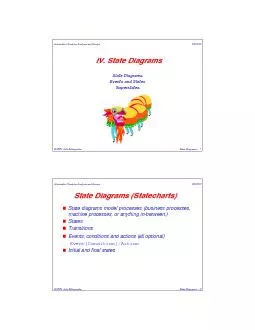
State Diagrams -- 1
by trish-goza
State Diagrams -- 2State diagrams model processes ...
Diagram review
by cheryl-pisano
INF 123 – Software architecture. tdebeauv@uci.e...
Sequence diagram example
by tawny-fly
T120B029. P7. 2012 pavasaris. What is the purpose...
UML Class Diagrams
by tatyana-admore
Chapter 16. Applying UML and Patterns. Craig Larm...
Beyond Feynman Diagrams
by lindy-dunigan
Lecture 2 . Lance Dixon . Academic Training Lectu...
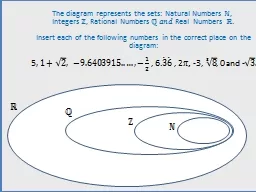
The diagram represents the sets: Natural
by min-jolicoeur
Numbers . Integers . Rational. . Numbers. Real N...
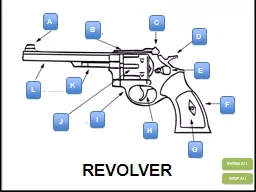
1 Double Action Revolver Diagram
by jane-oiler
SHOW ALL. HIDE ALL. A. B. C. D. F. G. H. I. J. K....
TACTICAL DIAGRAMMING
by liane-varnes
Why it . works. Three components of Tactical Diag...
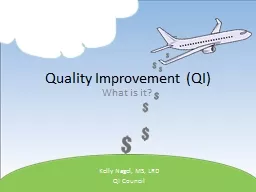
Quality Improvement (QI)
by ellena-manuel
What is it?. Kelly Nagel, MS, LRD. QI Council. Ag...
Continuous Improvement of School Climate Through a Data-Dri
by alexa-scheidler
Session S12. Will Black, Principal. Laura Walker,...
Load More...