Explore
Featured
Recent
Articles
Topics
Login
Upload
Featured
Recent
Articles
Topics
Login
Upload
Search Results for 'range plot'
range plot published presentations and documents on DocSlides.
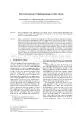
Chart ImageImage Annotation C2
by erica
Text Detection and Recognition (C5)CNNClassi�...
Histograms & Comparing Graphs
by danika-pritchard
4. 3. 2. 1. 0. In addition to level 3.0 and above...
Unit 6 Review Measures of Central Tendency, Measures of Variation
by myesha-ticknor
Displaying Data. Question 1a. What does 30 repres...
Warm Up! Write down objective and homework in agenda
by ellena-manuel
Lay out homework (none!!). Homework (Box Plot . w...
Box Plots
by test
Lesson . 8.04. After completing this lesson, you ...
Bell - Ringer Review Plot the following coordinates:
by olivia-moreira
(2 , 6) , ( -4 , 2) , ( 3 , 0) , (1 , -5) , ( - 2...
Survey on distributed natural gas quality
by pasty-toler
Nicola . Zaccarelli. , Eveline Weidner, Daniele ....
ζ Cumulative Frequency Graphs
by trish-goza
Dr Frost. Starter: Problems involving mean. T...
Box and Whiskers
by ellena-manuel
Tammy Wallace. Varina High. A box-and-whiskers pl...
Box and Whisker Plots
by faustina-dinatale
and Quartiles. Sixth Grade. Five Statistical Summ...
Click when ready
by pasty-toler
. Whiteboardmaths.com. © 2004 - 2008 All righ...
YEAR 11 MATHS REVISION
by phoebe-click
Box Plots. Cumulative Frequency with Box Plots. D...
Plots and Logs
by luanne-stotts
Plots and Stuff. 1. A plot is. a two-dimensional ...
Box and Whisker Plots
by briana-ranney
A diagram that summarizes data by dividing it int...
Chapter 6.4
by mitsue-stanley
Box and Whisker Plots. Quartile: include . Inter-...
Box and Whisker Plots A diagram that summarizes data by dividing it into four parts.
by natalia-silvester
It compares two sets of data.. Box and Whisker Pl...
7-5 Box-and-Whisker Plots
by lindy-dunigan
Course 2. Warm Up. Problem of the Day. Lesson Pre...
Week 3 Lecture 2 Chapter 5.
by pamella-moone
The Standard Deviation as a Ruler . and . the Nor...
CS 5163 Introduction to Data Science
by test
Part 2: Plotting, basic statistics. 2.1 Basic plo...
CS229 Python & Numpy
by tawny-fly
CS229 Python & Numpy Jingbo Yang, Andrey Kure...
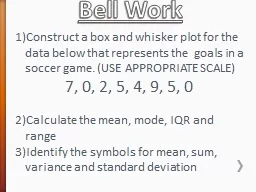
Bell Work Construct a box and whisker plot for the data below that represents the goals in a soccer game. (USE APPROPRIATE SCALE)
by faustina-dinatale
Bell Work Construct a box and whisker plot for th...
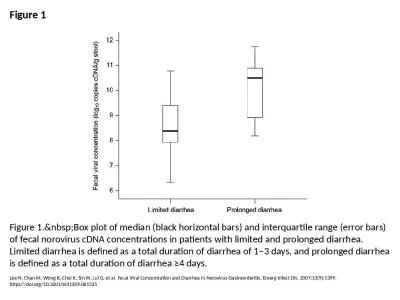
Figure 1 Figure 1. Box plot of median (black horizontal bars) and interquartile range (err
by arturo
Lee N, Chan M, Wong B, Choi K, Sin W, Lui G, et al...
Load More...