/
Introduction to flood risk assessment with HEC-FDA Introduction to flood risk assessment with HEC-FDA

Introduction to flood risk assessment with HEC-FDA - PowerPoint Presentation

smith
smith . @smith
Follow
1 views
Uploaded On 2024-03-13

Introduction to flood risk assessment with HEC-FDA - PPT Presentation

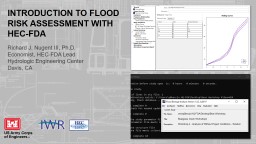
Richard J Nugent III PhD Economist HECFDA Lead Hydrologic Engineering Center Davis CA agenda What is flood risk and how do we describe it How do we assess flood risk What goes into the uncertainty about flood risk ID: 1048026

risk flood probability uncertainty flood risk uncertainty probability assurance exceedance structures stage water annual damage flow hydraulic aep event

Share:

Link:

Embed:

Download Presentation from below link

Download Presentation The PPT/PDF document "Introduction to flood risk assessment wi..." is the property of its rightful owner. Permission is granted to download and print the materials on this web site for personal, non-commercial use only, and to display it on your personal computer provided you do not modify the materials and that you retain all copyright notices contained in the materials. By downloading content from our website, you accept the terms of this agreement.


Presentation Transcript

1. Introduction to flood risk assessment with HEC-FDA Richard J. Nugent III, Ph.D. Economist, HEC-FDA LeadHydrologic Engineering Center Davis, CA

2. agendaWhat is flood risk, and how do we describe it?How do we assess flood risk?What goes into the uncertainty about flood risk?Hydrology HydraulicsEconomics How do we incorporate our estimates of uncertainty about flood risk?I computed EAD. I am done, right? SPOILER ALERT: NOPE! 

3. This presentation draws upon materials authored by:Cameron AckermanNick ApplegateGary BrunnerBeth FaberGregory KarlovitsKurt Keilman John Kucharski Will LehmanBrian MaestriRichard NugentWilliam ScharffenbergAuthorship

4. What is flood risk?

5. What is flood risk?Risk AnalysisRisk AssessmentRisk ManagementRisk Communication

6. What is flood risk?

7. What is Flood Risk?

8. What is Flood Risk?Flood Risk (simplified) = Flood Probability x Flood ConsequencesPROBABILITYCONSEQUENCES

9. Components of Flood riskImage from Rijkswaterstaat, The Netherlands

10. Which study area has higher flood risk?Study Area A:50% Annual Chance of Flooding15-foot Flood DepthStudy Area B:1% Annual Chance of Flooding4-foot Flood DepthProbability x Consequences

11. How do we assess flood risk?

12. Hydrology – Focus is water in watershedAmount of water Rate of flowFrequency Hydraulics – Focus is water in channel/floodplainDepth of water for given rate of flowVelocity Geotechnical – Focus is levee performanceChance of failure for a given flood magnitude Economics – Focus is stuff in the floodplain Value of assets/number of people in the flood plain First floor elevations/number of storiesDamage/life loss for given flood magnitude Indirect economic impactHow do we assess flood risk?HazardPerformanceExposureVulnerability Consequences

13. lowhighlowhighMeasure of flood risk: expected annual damage (EAD)

14. Flood risk with uncertainty Hydrology (Flows)

15. lowhighlowhighHydrology: flow exceedance probability function

16. Hydrologic Data and relationshipsFlow-exceedance probability functions: what is the distribution of flows for a given exceedance probability?Analytical: flow can be described by the Log Pearson Type III (LP3) distribution, uncertainty defined by LP3 moments using Bulletin 17B procedures Graphical: flow cannot be described by LP3. Graphical draws a straight line between flow values. Uncertainty defined by equivalent record length and distance between flow values using order statistics and the less simple method.

17. Analytical using peak flows:Measurement uncertainty Transform uncertainty Sampling uncertaintyModel uncertainty Analytical or graphical using modeling:Boundary condition uncertainty Initial condition uncertaintyModel uncertaintyParameter uncertainty Hydrologic uncertainty

18. Hydrologic uncertainty

19. Flood risk with uncertaintyHydraulics (Stages)

20. lowhighlowhighHydraulics: stage-flow function

21. Hydraulic data and relationshipsWSP: WSEWSE at a given location and frequency WSE are computed using hydraulic modeling (e.g. RAS)WSE are used to compute damage at a structure, either through interpolation between stations or by identifying the WSE at the structure’s location (in the case of 2D modeling)Stage-Discharge Function (Rating Curve): what is the distribution of stages for a given discharge?Typically computed using observations on stage versus flowError bounds computed using hydraulic modeling Hydraulic structures: How does the water react to hydraulic structures?Levees, diversions, dams, weirds, drop structures, bridges, culverts, etc.

22. Water Surface Profiles:Applying procedures where assumptions are not validNumerical errors Geometry MeasurementParameter EstimationStage-Discharge:Changes in cross section and roughnessMeasurement errorInfluence of backwaterOther Factors?Hydraulic Structures:Bridge/culvert parametersInline Structures (dams, weirs, drop structures etc)Lateral structures (levees, diversions, etc)Boundary conditionsHydraulic uncertainty

23. Flood risk with uncertaintyLevee Performance

24. Uncertainty in Levee Performance

25. Flood risk with uncertaintyEconomics

26. lowhighlowhighEconomics: Stage-damage relationship

27. The Links from Water to Value to Damage

28. Stage-damage sources of uncertaintyPlanning Associates – Flood Risk Management Course28Number of structures by category and construction typeStructure values by building type and useContent values by building type and use First floor elevation of structureDamage as a percent of value for structure/contents for range of flood depthsDepth-percent damage with uncertainty

29. How do we incorporate our estimates of uncertainty into our risk assessment?CURVE SAMPLING!

30. FDA METHOD10Exceedance probability10Exceedance probabilitystagestageDamageDamageFlowFlowIntegrate!This process results in 1 realization of EAD, it is not the final estimate of EAD

31. Annual exceedance probability (for the hydrology)Damages.Number of realizationsAverage of the Realization EADs1st RealizationIntegration of the curve = Realization EAD1EAD01^Running AverageFDA EAD Compute with sampling31EAD estimatesMean = average = EADAnnual Damages

32. But wait, there is more! Project performance

33. Annual Exceedance Probability it is the probability that a specific capacity or target stage will be exceeded in a given year. For levees, it is the chance of failure or exceedance in any given year. AEP includes the full range of events. The inverse of the AEP should not be considered the level of protection for a project.ANNUAL EXCEEDANCE PROBABILITY

34. Long-term risk (also long-term exceedance probability) The probability that one or more flood events will occur within a specified time period or the likelihood the target stage will be exceeded in a specified time period. The calculations are made directly using the binomial distribution (See EM 1110-2-1415).  t  LONG-TERM RISK

35. = 0.995  LONG TERM RISK

36. Assurance (formerly conditional non-exceedance) The chance that a specific target (e.g. the top of a levee) will not be exceeded, given the occurrence of a specific flood event (e.g. “The project can pass a 1% flood event with 90% assurance.”)ASSURANCE OF EVENT

37. Assurance The chance that an annual overtopping or significant flooding event is less than a standard frequency (e.g. 1%). Assurance of AEP and Assurance of a target stage are equivalent in the absence of a fragility curve. ASSURANCE OF AEP

38. In the case that a levee fragility curve has been defined, assurance of AEP will not be the same as assurance of a given event. ASSURANCE OF AEP

39. QUESTIONS?