/
Flood Hazard mapping at the Bago City in the Bago River BasinMr MYO T Flood Hazard mapping at the Bago City in the Bago River BasinMr MYO T

Flood Hazard mapping at the Bago City in the Bago River BasinMr MYO T - PDF document

roy
roy . @roy
Follow
360 views
Uploaded On 2021-06-11

Flood Hazard mapping at the Bago City in the Bago River BasinMr MYO T - PPT Presentation

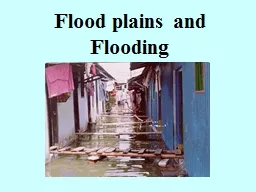
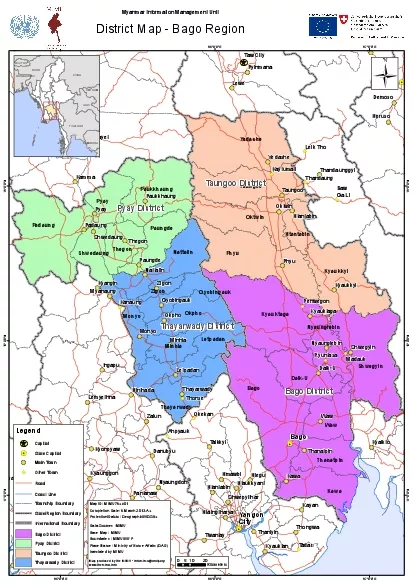
1Introduction 11Flood disaster statistics Flooding is one of the major hazards and the most devastating natural disasters in the world During the last decades floods led to loss of lives and pro ID: 839656

hazard flood hec map flood hazard map hec bago river myanmar ras figure water mapping city disaster return flooding

Share:

Link:

Embed:

Download Presentation from below link

Download Pdf The PPT/PDF document "Flood Hazard mapping at the Bago City in..." is the property of its rightful owner. Permission is granted to download and print the materials on this web site for personal, non-commercial use only, and to display it on your personal computer provided you do not modify the materials and that you retain all copyright notices contained in the materials. By downloading content from our website, you accept the terms of this agreement.


Presentation Transcript

1 Flood Hazard mapping at the Bago City in
Flood Hazard mapping at the Bago City in the Bago River BasinMr. MYO TUN OO1), Mr. THET HTOO NAING2) 1) Department of Meteorology and Hydrology, Nay Pyi Taw, Myanmar 2) Department of Meteorology and Hydrology, Nay Pyi Taw, Myanmar 1.Introduction 1.1Flood disaster statistics Flooding is one of the major hazards and the most devastating natural disasters in the world. During the last decades, floods led to loss of lives and properties, damage to critical infrastructures, economic losses and health related problems such as outbreak of water borne diseases when the lakes, ponds and reservoirs got contaminated. Therefore, many countries try to develop the flood hazard map with different technologies because flood hazard mapping is an important tool for engineers, planners, and government agencies used for municipal and urban growth planning, emergency action plans, flood insurance rates and ecological studies. By understanding the extent of flooding and floodwater inundation, decision makers are able to make choices about how to best allocate resources to prepare for emergencies and to generally improve the quality of life. Nowadays, Floods and inundations are the natural disasters that most frequently hit in Myanmar due to the climate change, land use land cover and river morphology changes. Through the end of June into August 2015, Myanmar had the most disastrous flood that it had worst experienced in 12 States and Regions out of 14 in Myanmar. Due to heavy seasonal rains since end June superimposed by storm winds from Cyclone Komen when it made landfall in Bangladesh on 30 July 2015. Monsoon related heavy rainfall and resultant flash and riverine floods caused devastat

2 ing disasters in a large part of Myanmar
ing disasters in a large part of Myanmar. The series flood killed 117 persons as of 31st August. 1615000 persons and 399.913 households were directly affected based on government sources. And also, the flooding has inundated more than 1.2 million acres of farmland, damaged 485 schools and 16741 homes. The extent of damage could have been reduced or minimized if an early warning system and systematic evacuation plan have in that place. There is also a need for an effective modeling to understand the problem and mitigate its disastrous effects. There are several factors contributing to the flooding problem ranging from topography, geomorphology, drainage, engineering structures, and climate. In the recent years, remote sensing and Geographic Information Systems have been embedded in the evaluation of the geo-environmental hazards. 1.2 Purpose of flood hazard mapping The purpose of flood hazard mapping is easy to manage flood disaster response mechanism and evacuate the people who living in the flood plain areas through the flood hazard map information. 2.Flood Hazard Mapping 2.1Method to develop flood hazard map The following flood frequency analysis method used to calculate the extreme discharge values of different return periods of 10 years, 20 years, 50 years and 100 years. The Chi-square test has to be used for choosing the best fit distribution of this flood hazard map development. 1.Normal Distribution 2.Log-normal Distribution 3.Pearson Type III Distribution 4.Log-Pearson Type III Distribution 5.Gumbel’s Distribution 2.2Scenario of external force to develop flood hazard map It is generally accepted that flood has been increasing in Myanmar in the last decade

3 s. Accordingly, it becomes a priority to
s. Accordingly, it becomes a priority to better understand the characteristics of flood and its drivers and mechanisms. And also, a flood characteristic is mainly depended on regional climatic pattern, river morphology, land use and land cover and climate change etc. If one of these factors is change in time, then so does the extreme floods. Consequently, flooding is going to make loss of life and damage their properties. Finally, it makes to reduce the GDP of our country. Nowadays, our country urgently needs to mitigate flood disaster impacts. This is one of scenario of external force to develop flood hazard map in Myanmar. 2.3Tools and software to develop flood hazard map The flood hazard map was by using HEC-RAS, HEC-GeoRAS, and Arc GIS. The methodology for developing flood hazard map can be explained by the following flow chart of methodology (Figure 1). Figure 1: Flow Chart of Methodology HEC-RAS model has been used to get the surface water profiles of areas Bago city. Frequency analysis of discharge data was carried out different flood frequency analysis methods. Secondly, geometry data were collected from the 10 m resolution of DEM. Digitization of selected stretch of study area on DEM is done using HEC-GeoRAS Tool the results of HEC-GeoRAS are exported to HEC-RAS in .sdf format. HEC-RAS simulates the annual flood peak.  \n  \rVarious data are required in setting up of the HEC-RAS model. One of the vital information is the geometrical information of a specific river stretch. The geometrical data of a river is prepared using a tool called HEC-GeoRAS which assists in preparing input file as well as post processing of the HEC-RAS results

4 in GIS environment. Using 10 m resoluti
in GIS environment. Using 10 m resolution of DEM on the study area, HEC-GeoRAS help to prepare the geometric data which is required for HEC-RAS. The important layers that are created are the stream centerline, Flow path centerlines, main channel banks and cross section cut lines as RAS layers. These parameters are used to establish series of cross-sections along the stream. HEC-RAS is a one dimensional flow model, intended for computation of water surface profiles for steady flow case. The present case, steady flow state is performed using standard step method. The initial boundary condition was assumed for normal depth condition as it was the only available data for the study area. Before simulating the model, certain initial conditions have to be defined viz- Normal depth, discharge at the inlet, manning’s “n” value, expansion and contraction values, etc., The model was simulated for various return periods to estimate the water surface profiles for subcritical condition as the Froude’s number was found to be less than 1 for the stream. The input data for the steady state will be peak discharge data for the particular return period. The model yields the water surface profiles for each of the flood magnitudes and the results are then again exported to HEC GeoRAS. Eventually, flood hazard map have to be generated with different return periods. 3.Dissemination of Flood inundation Map Information Flood hazard map is one of the critical tools for informing communities about the flood disaster risk and flood disaster management discussions. In this regards, Department of Meteorology and Hydrology (DMH) have already developed flood hazard map and flood inundation map for

5 different cities along Myanmar Rivers. A
different cities along Myanmar Rivers. After generating the flood hazard map, DMH have a meeting with water related organizations and departments, local authorities and communities at the respective cities in Myanmar. And then, DMH have got some advice and suggestion from this meeting about this flood hazard map is reliable and useful or not. Finally, DMH have to redevelop the flood hazard map at respective cities based on meeting suggestion and advice. And also, DMH have to disseminate the flood hazard map information to the communities through the local authorities, water related organization and department and DMH’s website. 4.Application of Flood Hazard Map 4.1Flood hazard map for Bago river basin 4.1.1Location of Bago River Basin Bago river basin is a flood prone area in Myanmar. The Bago city is one of flood prone area in the Bago river basin. It is located between 96°26´ E – 96°31´ E longitudes and 17°15´N – 17°22´ N latitudes in the southern central Myanmar (Figure 2). The Bago River flows from the Pegu Yoma mountain range at an elevation of 800 m.a.s.l. in the north, running south through meandering sections of over 331 km before it reaches the Yangon River near Yangon City. Figure 2: Location map of Study area 4.1.2Hydrological Characteristics of Bago River Basin The climate in the Bago river basin is characterized by tropical monsoon with distinct wet and dry seasons. The monthly normal rainfall at Bago gauging station is shown in Figure (3). And also, the yearly maximum water level of Bago gauging station is shown in Figure (4). According to floods at Bago city, it is generally occurred in monsoon season, especially in month of July and August. Figur

6 e 3: Monthly Normal Rainfall at Bago ga
e 3: Monthly Normal Rainfall at Bago gauging station (mm) Figure 4: Yearly maximum water level of Bago gauging station 4.1.3 Flood Hazard map for Bago River Basin Flood hazard maps are used for various ways especially in flood disaster management activities and city development planning. The following Figure (5) and (6) show the flood hazard maps of Bago city with 10, 20, 50 and 100 year return periods. This flood hazard map is also included the information about the flood inundation areas and flood depth that related to flood with different return periods. This flood hazard maps are also typically provided the location of school, hospital, airport, monastery, pagoda, church, university, railway, and highway road etc. Figure 5: 10 and 20 year return periods Flood hazard maps of Bago City Figure 6: 50 and 100 year return periods Flood hazard maps of Bago City 5.Good Practice and Lesson Learned from the Recent Floods 5.1Lesson Learnt from 2015 Nation-wide flooding Myanmar’s people are facing the nation-wide flooding in month of July and August 2015. This is due the Cyclone Komen that made landfall in Bangladesh on 30 July, has brought strong winds and additional heavy rain in Myanmar. That’s why, 12 out of 14 states and regions are flooded. At that time, our president U Thein Sein issued a statement proclaiming (1) Chin State, (2) Sagaing Region, (3) Magway Region and (4) Rakhine State, as natural disaster zones. During the flood, Government, NGOs, INGO, Civil Society Organization (CSO) and Community-Based Organization (CBO) are closely collaborated with each other to find out the best way flood response mechanism and drawn out the flood disaster management acti

7 vities in Myanmar. And also they evaluat
vities in Myanmar. And also they evaluate and help the people who living in flood prone areas. This is good practice and lesson learnt from the recent nation-wide flooding in 2015. References Ackerman, (September 2009). HEC-GeoRAS GIS Tools for Support of HEC-RAS Using ArcGIS. U.S Army Crops of Engineer, Hydrologic Engineering Center. Goodell C., W. C. (2006). Flood Inundation Mapping Using HEC-RAS. Obras y Proyectos,, P 18-23. Hashemyan F., K. M. (2015). Combination of HEC-HMS and HEC-RAS models in GIS in order Simulate Flood. Research Journal of Recent Sciences, Vol. 4(8), 122-127. Islam, M. A. (n.d.). Flood Hazard Mapping of Dhaka-Narayanganj-Demara(DND) Project Using Geo-Informatics Tools. unpublished, M.E Thesis Paper. Prafulkumar V. Timbadiya, P. L. (2011). Calibration of HEC RAS Model on Predition of Flood for Lower Tapi River, India. Journal of Water Resource and Protection, PP 805-811. Shantosh Karki, A. S. (2011). GIS Based Flood Hazard Mapping And Vulnerability Assessment of People Dut to Climate Change. East Nepal: unpublished. Shrestha, R. (2006). Rainfall-Runoff modeling of gauged and ungauge catchments using HEC HMS and GIS. Unpublished M.Tech Thesis submitted to IIT, Kharagpur, India. Sandhyarekha, A.V. Shivapur (2017).Floodplain mapping of river Krishnana using River HEC-RAS model at tow streache namely Kudachi and Ugar villages of Belagavi District, Karanataka, International Research Journal of Engineering and Technology (IRJECT), Volume 4, P 1524-1529 Sina Alaghmand, Rozibin Abdullah, Ismail Abustan and Behodkhat Vosoogh. (2010). GIS Based River Flood Hazard Mapping in Urban Area. International Journal Engineering and Technology, Vol. 2(6), P 488-50