PDF-Own Your Age (OYA)
1
Wela
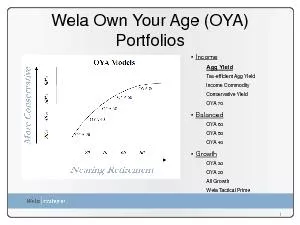
Portfolios Income
Agg
Yield
Tax efficient Agg
Yield
Income Commodity
Conservative Yield OYA 70 Balanced
OYA 60
OYA 50
OYA 40 Growth
OYA 30
OYA 20
All Growth
Wela
Tactical
Download Presentation
"Own Your Age (OYA)" is the property of its rightful owner. Permission is granted to download and print materials on this website for personal, non-commercial use only, provided you retain all copyright notices. By downloading content from our website, you accept the terms of this agreement.
Presentation Transcript
Transcript not available.